Beschreibung
Es ermöglicht den Benutzern, die Öffnungs- und Schließzeiten der wichtigsten Handelssitzungen – Asien, London, New York und London Close – mit anpassbaren Farben, Stilen und Dicken zu markieren. Dieser Indikator zeichnet Hoch- und Tief-Trendlinien für jede Sitzung und bietet Einblicke in das Marktverhalten. Mit der benutzerfreundlichen Drag-and-Drop(+Alt-Taste)-Funktionalität wird das Zeichnen von Hoch- und Tiefpunkten der Sitzungen schnell und einfach. Perfekt für Anfänger und erfahrene Trader erleichtert dieser Indikator die Navigation durch die Komplexität verschiedener Marktsitzungen.
Funktionen
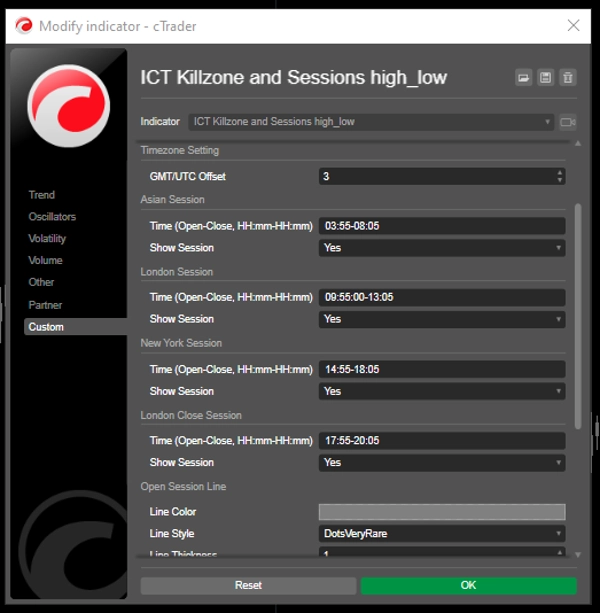
Anpassbare Sitzungszeiten: Benutzer können die Öffnungs- und Schließzeiten der wichtigsten Handelssitzungen (Asien, London, New York und London Close) definieren, was eine maßgeschneiderte Visualisierung ermöglicht, die zu ihren Handelsstrategien passt.
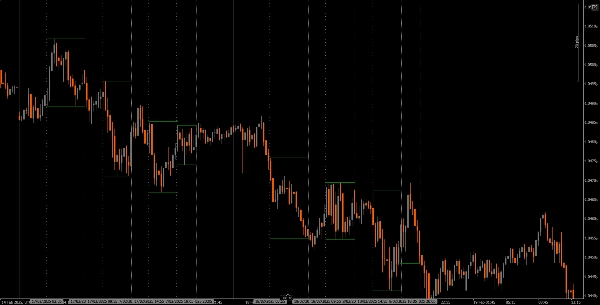
Dynamische vertikale Linien: Der Indikator zeichnet vertikale Linien zu den Öffnungs- und Schließzeiten der Sitzungen, wodurch wichtige Marktereignisse auf einen Blick erkennbar sind.
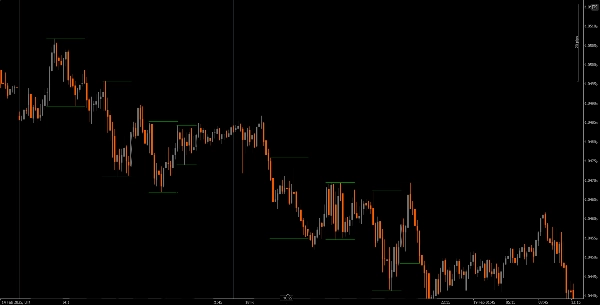
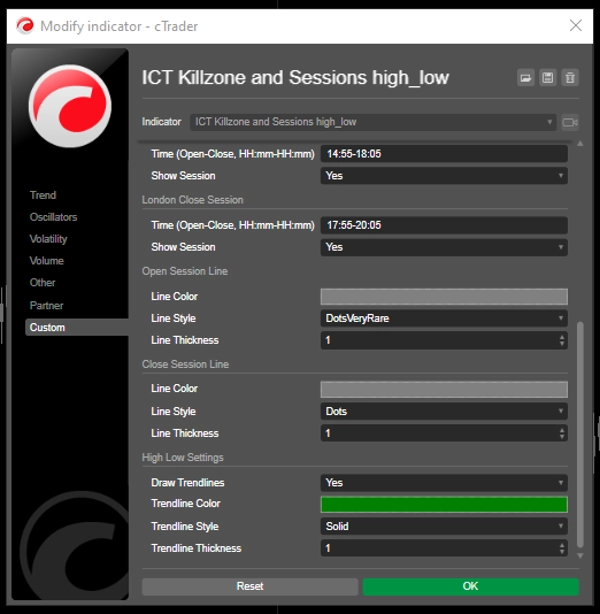
Trendlinien-Visualisierung: Er kann automatisch Hoch- und Tief-Trendlinien für jede Sitzung zeichnen, sodass Trader potenzielle Unterstützungs- und Widerstandsniveaus basierend auf der Kursentwicklung der Sitzung erkennen können.
Benutzerfreundliches Drag-and-Drop(+Alt-Taste): Die Drag-and-Drop(+Alt-Taste)-Funktion ermöglicht es Tradern, einfach bestimmte Zeitbereiche zur Analyse auszuwählen und verbessert so das gesamte Benutzererlebnis.
Sitzungsbeschriftungen: Die Option, Beschriftungen neben den Trendlinien der Sitzungen anzuzeigen, sorgt für Klarheit und hilft Tradern, schnell zu erkennen, welche Sitzung sie analysieren.
Zeitzonenanpassung: Benutzer können einen GMT/UTC-Versatz einstellen, um sicherzustellen, dass die Sitzungszeiten entsprechend ihrer lokalen Zeitzone genau dargestellt werden.
Anleitung
Installation: Laden Sie den ICT Killzone und Sessions high_low Indikator herunter und installieren Sie ihn auf Ihrer cAlgo-Plattform.
Einrichtung: Öffnen Sie die Einstellungen, um Ihre Sitzungszeiten, Farben, Linienarten und Dicken nach Ihren Vorlieben anzupassen.
Verwendung des Indikators: Klicken und ziehen Sie (+ Alt-Taste) auf dem Chart, um ein Rechteck zu erstellen, das den Zeitbereich umfasst, den Sie analysieren möchten. Der Indikator zeichnet automatisch vertikale Linien und Trendlinien für die angegebenen Sitzungen.
Analyse: Beobachten Sie die Sitzungs- und Trendlinien während des Handels. Verwenden Sie diese Informationen, um potenzielle Unterstützungs- und Widerstandsniveaus basierend auf den Sitzungsdynamiken zu identifizieren.
Empfohlene Begleitwerkzeuge
cTrader: Die native Plattform für cAlgo, die ein nahtloses Erlebnis bei der Nutzung und Anpassung von Indikatoren bietet.
Marktanalyse-Tools: Kombinieren Sie diesen Indikator mit Marktanalyse-Tools wie gleitenden Durchschnitten oder Oszillatoren, um Ihre Handelsstrategie zu verbessern.
Risikomanagement-Tools: Verwenden Sie Positionsgrößenrechner und Stop-Loss-Tools, um das Risiko beim Handel effektiv zu steuern.
Durch die Integration des ICT Killzone und Sessions high_low Indikators mit diesen Werkzeugen können Trader ihre Marktanalyse verbessern und ihre Erfolgschancen bei der Navigation durch die Komplexität verschiedener Handelssitzungen erhöhen.
Zusammenfassung
A drag-and-drop (+Alt Key) feature allows quick selection of specific time ranges for analysis. Optional session labels clarify which session is being viewed. Timezone adjustments via GMT/UTC offset ensure session times align with the trader’s local time zone.
Designed for use on the cAlgo platform, this tool supports enhanced market analysis when combined with other market analysis and risk management tools. It assists traders in navigating the complexities of different market sessions by providing clear visual cues and trendline insights.
Kundenbewertungen
5 | 40 % | |
4 | 20 % | |
3 | 0 % | |
2 | 0 % | |
1 | 40 % |