„Moving Average channel“-Logo
Indikator
170 downloads
Version 1.0, Jan 2025
Windows, Mac
In „Moving Average channel“ hochgeladenes Bild
15
Verkäufe
4.4K
Kostenlose Installationen

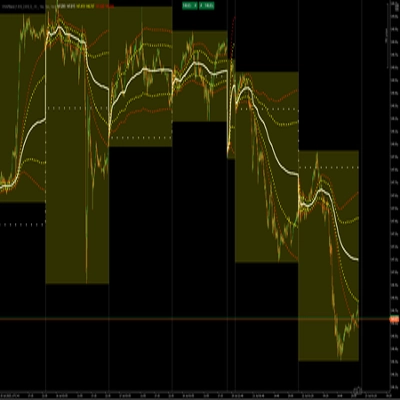
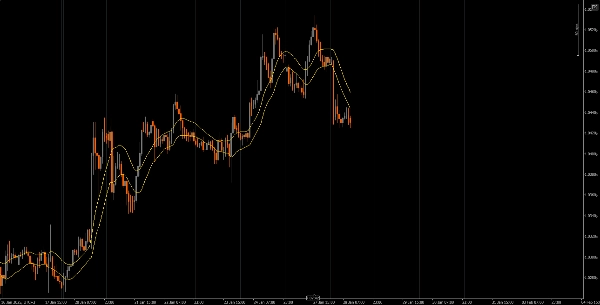
Anpassbare gleitende Durchschnitte (MAs) in einem Diagramm, unter Verwendung verschiedener Arten von MAs (Einfach, Gewichtet, Exponentiell) und Preisdatenquellen (Schluss, Eröffnung, Hoch, Tief)
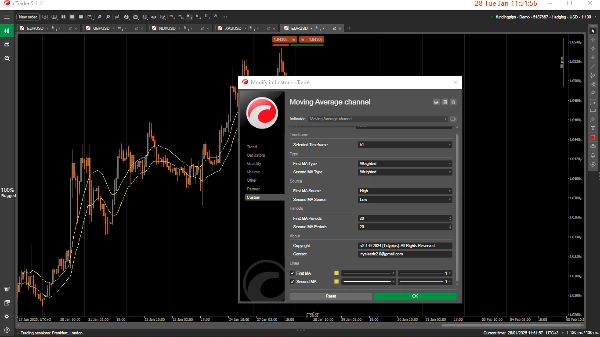
Der WMA- und SMA-Indikator bietet Flexibilität bei der Visualisierung gleitender Durchschnitte basierend auf benutzerdefinierten Parametern. Er unterstützt drei Arten von gleitenden Durchschnitten: Einfach (SMA), Gewichtet (WMA) und Exponentiell (EMA). Der Benutzer kann diese Durchschnitte auf verschiedene Datenquellen anwenden wie Schluss, Eröffnung, Hoch, Tief oder berechnete Werte wie Median, Typisch und Gewichtete Preise.

Dieses Tool ermöglicht es Ihnen auch, den Zeitraum auszuwählen, für den der Indikator aktiv ist, sodass Sie sich auf bestimmte Datenperioden konzentrieren können, ohne Ihre Diagramme mit unnötigen Informationen zu überladen.

Schauen Sie sich auch andere nützliche Indikatoren an, die ich veröffentlicht habe. Wenn Sie diesen oder einen meiner anderen Indikatoren hilfreich finden, erwägen Sie bitte, meine Arbeit durch einen Kauf oder eine Spende zu unterstützen. Ihre Unterstützung hilft mir nicht nur, diese Tools weiterzuentwickeln und zu verbessern, sondern stellt auch sicher, dass ich weiterhin neue, wertvolle Indikatoren erstellen kann, um Ihr Handelserlebnis zu verbessern. Vielen Dank für Ihre fortwährende Unterstützung!


https://buymeacoffee.com/tidypips

Indikatorprofil
0.0
Bewertungen: 0
Kundenbewertungen
Bisher gibt es keine Bewertungen für dieses Produkt. Haben Sie es schon ausprobiert? Dann können Sie die erste Person sein, die andere darüber informiert!
Über den cTrader Store verfügbare Produkte, einschließlich Handelsbots, Indikatoren und Plugins, werden von externen Entwicklern bereitgestellt und nur zu Informations- und technischen Zugriffszwecken verfügbar gemacht. cTrader Store ist kein Broker und erbringt keine Anlageberatung, persönlichen Empfehlungen oder eine Garantie für zukünftige Performance.

Mehr von diesem Autor

Indikator
This indicator is an essential tool for traders seeking to visualize key trading sessions on their charts.
Indikator
XAUUSD
Commodities
A Fair Value Gap (FVG) indicator that identifies potential price imbalances, potential reversal and continuation zones
Indikator
Useful indicator for traders who want to visualize key price levels based on previous daily highs and lows.
Indikator
This indicator is a valuable tool for traders looking to identify significant opening price level of any asset.
Indikator
A rectangular box with 5 adjustable Fibonacci level or even custom ones.
Indikator
XAUUSD
Commodities
This indicatorFull Description: Th shows the open price lines at key market times based on Eastern Standard Time (EST).
Indikator
Plots the equilibrium price levels based on previous daily highs and lows.

Das könnte Sie auch noch interessieren

Indikator
Liquidity Grab
Liquidity Sweep
+1
CRT Sweep Tracker is an advanced panel for Candle Range Theory (CRT) traders to track HTF sweeps and manage live trades.
Indikator
ATR
EMA
+3
The UTBot you know from TradingView — now on cTrader with confirmed signals, VWAP, EMA and session overlays.
Indikator
RSI
Signal
+1
🚀📈 Plot buy/sell signals on Range Bars using Moving Averages and RSI. Clear, actionable trading insights.🚀📈
Indikator
Forex
Crypto
+5
Experience a new approach with amplitude-based momentum analysis. Smart Trend Detection That Adapts to Market Volatility
Indikator
Inducement
Key Levels
+5
Digital Clock Overlay that displays a live, second-by-second clock and optional date directly on the trading chart.
Indikator
SMC
Forex
+7
Simple Smart Money Concepts (SMC)
Indikator
SMC
Prop
+18
Fixed Range Volume Profile (FRVP) : analyzes price volume within a custom rectangle to find POC, VAH, and VAL.
Indikator
AI-assisted
Predictive Monte Carlo Engine Forecast future price paths using institutional-grade statistical models and probability
Indikator
AI
Prop
+7
EMA Clouds, Multi-Timeframe (MTF) Overlay, Swing High/Low detection, and a smart Dashboard with neutral zone filtering.
Indikator
Breakout
FlexSR auto‑detects pivot highs/lows to plot dynamic support & resistance lines Features customizable styling and option
Indikator
ATR
Prop
+7
Smart momentum tool uses advanced filtering and colour cues for clearer market direction and trading signals.
Indikator
Market Structure
Support & Resistance
Auto-centers price when it moves beyond threshold. Adjustable zoom. Works on any chart type. Never lose price again.
Indikator
Indices
Multi-Timeframe ADX Trend Dots & Arrows
Indikator
ATR
RSI
+7
Visual tool tracking financial assets' % performance across timeframes, highlighting trends with color-coded insights.
Indikator
Forex
Enhance your trading strategy with automated detection and alerts for key chart patterns.
Indikator
Forex
Version 3: Full control of session display including start and end times of all 3 sessions!
Indikator
RSI
Forex
+4
New version of one of my favorites includes Fibonacci and moving average convergence divergence lines
Indikator
cTreder Smart SMA
15
Verkäufe
4.4K
Kostenlose Installationen