
VegaXLR - Auto Support and Resistance
Indikator
5 käufe
Version 1.0, Feb 2025
Windows, Mac
4.3
Bewertungen: 3
Beschreibung
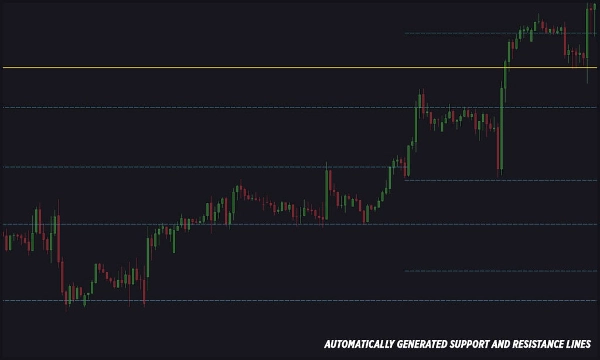
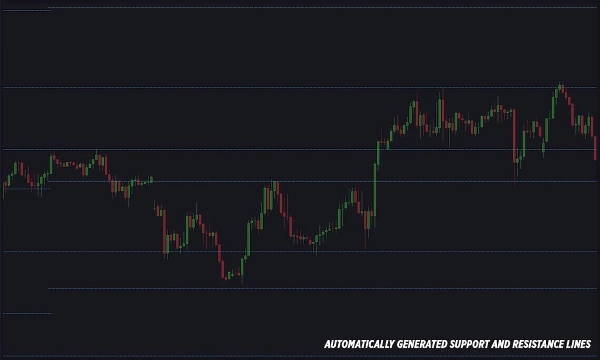
Dieser cTrader-Indikator zeichnet automatisch Unterstützungs- und Widerstandslinien in Ihrem Chart, was ihn sowohl für Anfänger als auch für Profis einfach zu verwenden macht. Die Linien werden basierend auf wichtigen Fibonacci-Niveaus und Preisschwankungen (Zickzack) generiert.
Funktionen:
- Erkennt und zeichnet automatisch Unterstützungs- und Widerstandslinien.
- Vollständig anpassbare Linienarten, Dicke und Farben.
- Anpassbare Anzahl von Unterstützungs- und Widerstandslinien.
- Benachrichtigungen, wenn der Preis mit Unterstützungs- oder Widerstandslinien interagiert.
- Mehrere Alarmoptionen: Telegram, E-Mail, Pop-ups und Sounds.
- Möglichkeit, auszuwählen, welche Fibonacci-Niveaus die Linien erzeugen.
- Option, Alarme von Ask- oder Bid-Preisliniën auszulösen.
- Konfigurierbare Alarmbedingungen: Bar-Close-Alarme oder sofortige Preisberührungsalarme.
- Anpassbare Alarmnachrichten mit benutzerdefinierten Kommentaren.
- Option, Alarme nur für starke Unterstützungs- und Widerstandsniveaus zu aktivieren.
- Möglichkeit, Chart-Screenshots zu erfassen und über Telegram zu senden (Chart muss sichtbar sein).
- Einfache Einrichtung von E-Mail-Benachrichtigungen.
- Schneller Zugriff auf die Benutzeranleitung über eine kleine Schaltfläche im Chart.
Zusammenfassung
KI-Zusammenfassung
VegaXLR - Auto Support and Resistance is a cTrader indicator that automatically identifies and draws support and resistance lines on trading charts. It uses key Fibonacci levels combined with price swing analysis (zigzags) to generate these lines, aiding traders in recognizing critical price levels. The indicator offers full customization of line styles, thickness, and colors, and allows adjustment of the number of support and resistance lines displayed.
It features real-time alerts triggered when price interacts with these levels, with configurable conditions such as bar-close or instant price-touch alerts. Alert notifications can be sent via multiple channels including Telegram, Email, pop-ups, and sounds. Users can specify which Fibonacci levels to use for line generation and choose whether alerts trigger from Ask or Bid price lines. Additional options include enabling alerts only for strong levels, customizing alert messages, and capturing chart screenshots to send via Telegram.
A user guide is accessible directly from the chart for ease of use. This tool supports Forex markets and is designed to assist both beginners and professionals in technical analysis by automating the detection of key support and resistance zones.
Indikatorprofil
Kundenbewertungen
4.3
Bewertungen: 3
5 | 67 % | |
4 | 0 % | |
3 | 33 % | |
2 | 0 % | |
1 | 0 % |
Kundenbewertungen
March 2, 2025
Focused trade layer if the trader wants it keeps attention on levels that actually matter. It works best as support, not a final decision maker. The cleanest use is 3 to 5 levels per chart, with 0.5 pullbacks checked before entry. not every zone holds, even if it looks clean.
March 1, 2025
March 1, 2025
Balanced demo helper for traders who build plans around market levels. It gives value around key price zones, but not every zone holds, even if it looks clean. I would wait for 2 reactions and avoid trades where the target is less than 1.5R. Levels are useful when they reduce noise, not when they crowd the chart.
Diskussion
Häufig gestellte Fragen (FAQ)
Forex
Über den cTrader Store verfügbare Produkte, einschließlich Handelsbots, Indikatoren und Plugins, werden von externen Entwicklern bereitgestellt und nur zu Informations- und technischen Zugriffszwecken verfügbar gemacht. cTrader Store ist kein Broker und erbringt keine Anlageberatung, persönlichen Empfehlungen oder eine Garantie für zukünftige Performance.


Preis
215
Verkäufe
680
Kostenlose Installationen