
Daily SD Levels - Indicator
Indikator
4 käufe
Version 1.0, Aug 2025
Windows, Mac
5.0
Bewertungen: 1
Beschreibung
Tägliche SD-Niveaus – Dynamische VWAP-basierte Standardabweichungsbänder
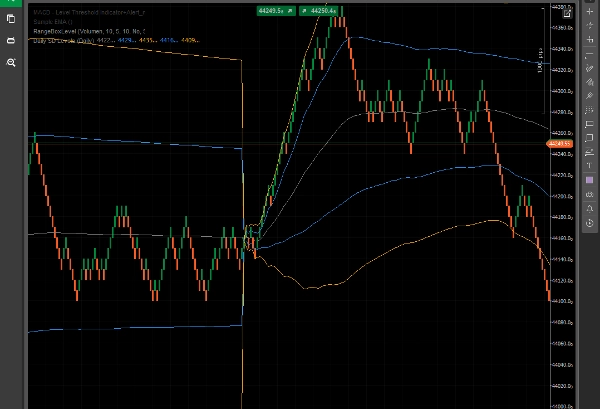
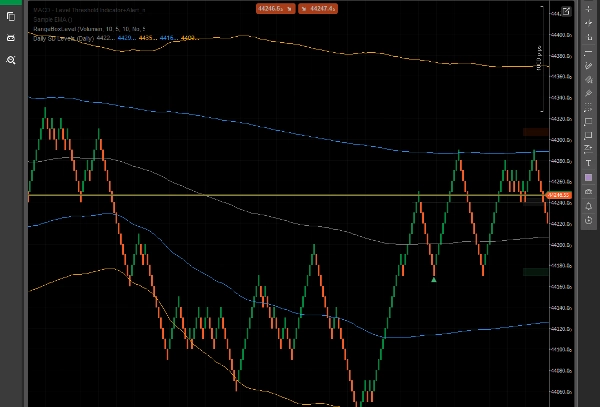
Der Tägliche SD-Niveaus Indikator zeigt dynamische VWAP (Volumen-gewichteter Durchschnittspreis) und Standardabweichungsbänder (+1/+2 und -1/-2), berechnet über den aktuellen Handelstag.
Dieses Tool hilft Händlern, die Intraday-Volatilität visuell einzuschätzen, potenzielle Unterstützungs-/Widerstandszonen und Preisausreißer, alles basierend auf tatsächlichem Marktvolumen und Kursbewegungen – keine festen oder willkürlichen Niveaus.
Hauptmerkmale:
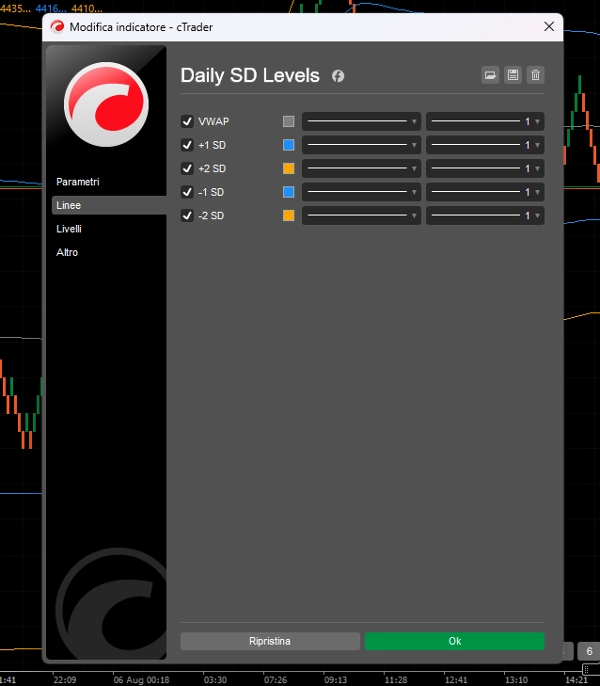
- VWAP-Linie zur Verfolgung des intraday fairen Werts.
- +1/+2 und -1/-2 SD-Bänder zur Identifikation von überkauften/überverkauften Zonen.
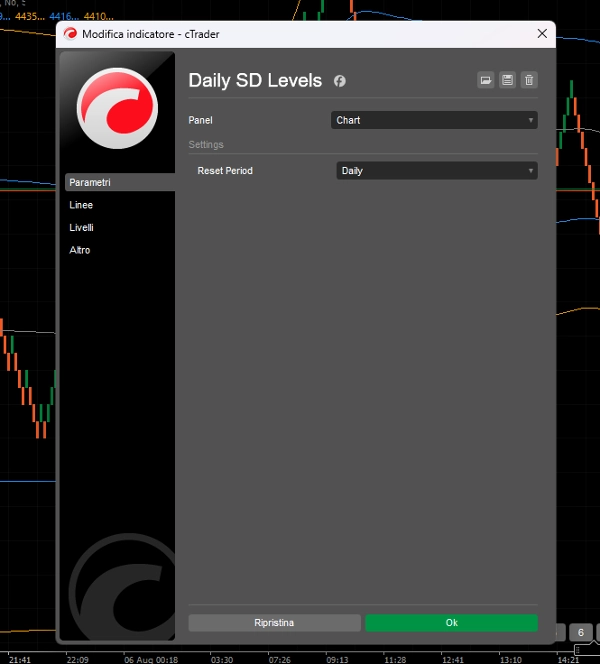
- Niveaus setzen sich täglich zurück und passen sich an die Preis- und Volumendynamik jeder Sitzung an.
- Optimiert für Renko-, Range-Bar- und Intraday-Handel.
- Entwickelt für Händler, die Klarheit und dynamische Preiszonen benötigen.
Dieser Indikator ist perfekt für:
- Mean-Reversion-Setups.
- Erkennung von überdehnten Bewegungen für mögliche Umkehrungen.
- Visuelle Bestätigung von Ausbrüchen über statistische Grenzen hinaus.
Kein Durcheinander. Nur saubere, reaktionsfähige Niveaus, die sich mit dem Markt bewegen.
Zusammenfassung
Indikatorprofil
Kundenbewertungen
5.0
Bewertungen: 1
5 | 100 % | |
4 | 0 % | |
3 | 0 % | |
2 | 0 % | |
1 | 0 % |
Kundenbewertungen
August 8, 2025
it gives context without making the decision, but the chart still needs a human read.
Diskussion
Häufig gestellte Fragen (FAQ)
Über den cTrader Store verfügbare Produkte, einschließlich Handelsbots, Indikatoren und Plugins, werden von externen Entwicklern bereitgestellt und nur zu Informations- und technischen Zugriffszwecken verfügbar gemacht. cTrader Store ist kein Broker und erbringt keine Anlageberatung, persönlichen Empfehlungen oder eine Garantie für zukünftige Performance.


Preis
Seit 16/07/2025
5
Verkäufe