
Opis
✅ Identyfikuje warunki wykupienia i wyprzedania z normalizowanym momentem
✅ Używa wygładzonej centralnej ceny opartej na EMA do stabilnego generowania sygnałów
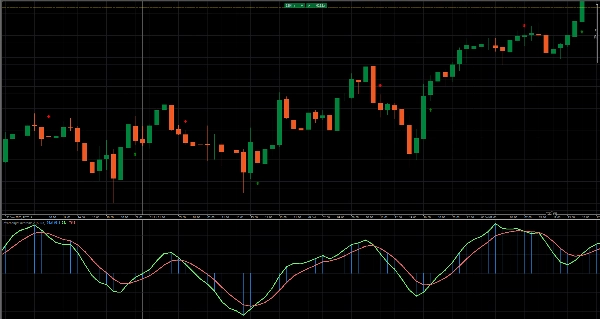
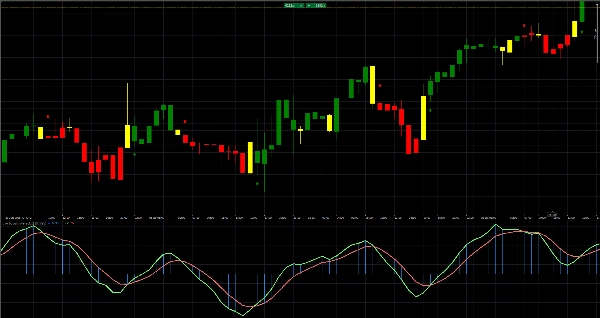
✅ Wyświetla podwójne histogramy (Oo i Ll) do wizualizacji presji momentu
✅ Kolorowe słupki natychmiast pokazują fazy bycze, niedźwiedzie lub niezdecydowane
✅ Oznacza precyzyjne punkty KUPNA i SPRZEDAŻY za pomocą ścisłych strzałek przecięcia
Podnieś swoją precyzję dzięki wskaźnikowi wykupienia/wyprzedania: oblicza wygładzoną centralną cenę (ys1) za pomocą EMA, normalizuje moment przez odchylenie standardowe i rysuje podwójne histogramy (Oo i Ll) wraz z liniami EMA w górę/w dół. Kolorowe słupki natychmiast podkreślają bycze (zielone), niedźwiedzie (czerwone) lub niezdecydowane (żółte) zmiany momentu, podczas gdy ścisłe strzałki przecięcia oznaczają precyzyjne punkty kupna i sprzedaży. Dodaj tę nakładkę do swojego wykresu, aby uzyskać krystalicznie czyste sygnały wykupienia/wyprzedania i pewnie wyznaczać momenty wejścia i wyjścia!
Dostępne także jako CBOT overbought oversold cbot cBot - cTrader Store
Podsumowanie
Opinie klientów
5 | 100 % | |
4 | 0 % | |
3 | 0 % | |
2 | 0 % | |
1 | 0 % |


