
Penerangan
WICK COMMANDER — Ketahui Dengan Tepat Bila Pasaran Membuat Komitmen
Kebanyakan pedagang menonton lilin. Wick Commander menonton niat.
Setiap lilin menceritakan sebuah kisah — tetapi penutupan yang mendedahkan kebenaran. Wick Commander mengesan tinggi dan rendah lilin sebelumnya dan menunggu harga untuk ditutup melebihi julat itu dengan keyakinan. Tiada palsu sumbu. Tiada bunyi bising. Hanya pecahan yang disahkan disokong oleh penutupan lilin penuh.
BAGAIMANA IA BERFUNGSI
Logiknya sangat tajam:
Satu isyarat BELI diaktifkan apabila lilin menaik ditutup di atas tinggi lilin sebelumnya — harga bukan sahaja menembusi, ia membuat komitmen. Satu isyarat JUAL diaktifkan apabila lilin menurun ditutup di bawah rendah lilin sebelumnya — penjual mengambil kawalan penuh.
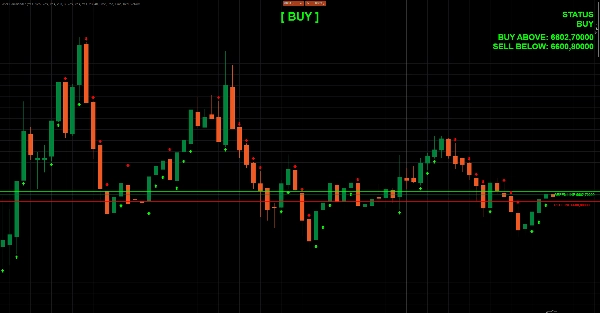
Dua garis dinamik dikemas kini secara masa nyata pada carta anda. Garis hijau menandakan tahap pecahan ke atas. Garis merah menandakan tahap keruntuhan ke bawah. Apabila harga ditutup melebihi mana-mana garis dengan arah lilin yang betul, anak panah dicetak dan papan pemuka dikemas kini serta-merta.
APA YANG ANDA LIHAT DI CARTA
- 🟢 Garis hijau — ambang beli langsung (tinggi lilin sebelumnya)
- 🔴 Garis merah — ambang jual langsung (rendah lilin sebelumnya)
- ⬆️ Anak panah beli — dicetak di bawah lilin isyarat pada pecahan menaik yang disahkan
- ⬇️ Anak panah jual — dicetak di atas lilin isyarat pada keruntuhan menurun yang disahkan
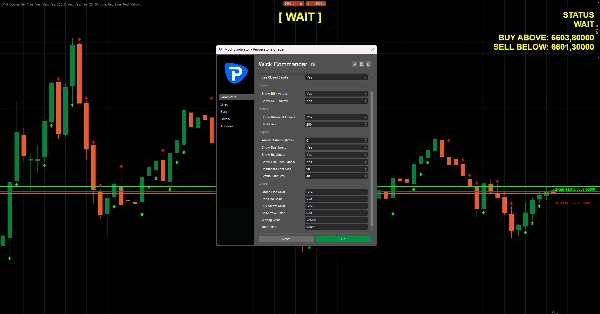
- 📊 Panel papan pemuka — menunjukkan status semasa (BELI / JUAL / TUNGGU), harga pencetus tepat, dan dikemas kini setiap bar
- 🔵 Paparan status besar — label besar di tengah yang menunjukkan bias pasaran semasa dengan sekilas pandang
- 🕓 Imbasan sejarah penuh — melihat kembali sehingga 5000 bar supaya anda boleh segera mengesahkan kualiti isyarat pada instrumen dan jangka masa anda
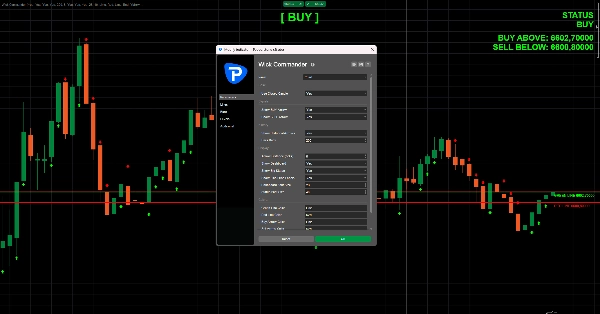
CIRI-CIRI
- Berfungsi pada mana-mana jangka masa dan mana-mana instrumen
- Beralih antara pengesahan lilin tertutup dan mod lilin langsung
- Kawalan penuh ke atas jarak anak panah, warna, saiz fon, dan elemen paparan
- Lapisan isyarat sejarah untuk ujian semula segera pada carta
- Logik tanpa cat semula yang bersih — isyarat berdasarkan lilin tertutup sahaja (apabila mod pengesahan diaktifkan)
- Tiada data luaran, tiada internet diperlukan —
AccessRights.None, sepenuhnya serasi dengan Store
SIAPA YANG SESUAI?
Pedagang pecahan, pedagang momentum, dan sesiapa yang penat dengan pecahan sumbu palsu. Jika anda mahukan isyarat berasaskan peraturan yang bersih yang hanya diaktifkan apabila lilin benar-benar ditutup melebihi julat sebelumnya — Wick Commander adalah alat anda.
Peraturan mudah. Visual yang bersih. Tiada keraguan kedua.
Ambil kawalan ke atas sumbu.
Ringkasan
Key features include:
- Real-time dynamic lines on the chart: a green line marking the previous candle’s high (buy threshold) and a red line marking the previous candle’s low (sell threshold).
- Buy signals trigger when a bullish candle closes above the previous high; sell signals trigger when a bearish candle closes below the previous low.
- Visual cues include arrows indicating buy or sell signals and a dashboard panel displaying current market status (BUY, SELL, WAIT) with exact trigger prices.
- A large status display provides an at-a-glance market bias.
- Historical signal overlay allows backtesting up to 5000 bars.
- Customizable display options for arrow distance, colors, and fonts.
- Operates on any timeframe and instrument without external data or internet connection.
- Supports toggle between closed-candle confirmation and live-candle mode with zero repaint logic when confirmation mode is enabled.
Wick Commander is suited for breakout and momentum traders seeking clear, rules-based signals based on candle close confirmations across markets including forex, indices, commodities, stocks, and cryptocurrencies.


![Logo "[Hamster-Coder] Pivot Points MTF"](https://cdn.ctrader.com/image/webp/4c143e5a-309c-40e3-a578-f04d1e133ffa_31159)


