
Penerangan
🔧 ATR_RR_SignalPanel — Penerangan Teknikal & Terperinci (EN) 🧠📈
ATR_RR_SignalPanel adalah penunjuk lapisan atas untuk cTrader yang menjana isyarat kemasukan perubahan tren menggunakan regim EMA Pantas vs EMA Perlahan, kemudian membina satu rangka dagangan maya lengkap (Kemasukan 🏁, Henti Rugi 🛑, Ambil Untung Akhir 🎯, Sasaran Sementara 🟢) menggunakan saiz risiko berasaskan ATR dan pemboleh ganda Risiko:Ganjaran yang boleh dikonfigurasikan ⚖️.
🧭 Logik Teras (Enjin Isyarat) 🚦
- Penunjuk mengira:
-
- EMA Pantas ⚡ dan EMA Perlahan 🐢 pada Tutup.
- ATR (pelicinan Wilder) 🌡️ untuk jarak henti berdasarkan volatiliti.
- Satu regim tren ditakrifkan sebagai:
-
- Tren lembu 🟢 apabila
EMA Pantas > EMA Perlahan - Tren beruang 🔴 apabila
EMA Pantas < EMA Perlahan
- Tren lembu 🟢 apabila
- Satu Perubahan Tren 🔁 dicetuskan apabila keadaan lembu/beruang berbeza daripada bar sebelumnya (setara dengan Pine’s
bullTrend != bullTrend[1]).
🎯 Syarat Kemasukan (BELI/JUAL) 🟩🟥
Apabila perubahan tren berlaku:
- Isyarat BELI 🟢 jika:
-
- Tren lembu aktif dan perubahan tren dikesan
- Pengesahan lilin pilihan ✅: Tutup > Buka (lilin menaik)
- Isyarat JUAL 🔴 jika:
-
- Tren beruang aktif dan perubahan tren dikesan
- Pengesahan lilin pilihan ✅: Tutup < Buka (lilin menurun)
🧪 Pengurusan Kedudukan Maya (Bukan cBot) 🧩
Penunjuk ini tidak meletakkan pesanan. Sebaliknya ia mensimulasikan “kedudukan maya” dalaman:
- Pada isyarat BELI/JUAL baru ia menetapkan:
-
- Harga Kemasukan = tutup semasa 🏁
- Henti Rugi = ekstrem lilin ± ATR × pemboleh ganda 🛑
- Ambil Untung Akhir = Kemasukan ± (Risiko × RisikoGanjaran) 🎯
- Tahap TP Sementara = langkah pada 1R, 2R, … sehingga floor(RR)-1 🟢
- Ia memantau tindakan harga bar demi bar:
-
- Jika TP akhir disentuh ➜ menandakan 🎯 dan menutup kedudukan maya ✅
- Jika SL disentuh ➜ menandakan 🛑 dan menutup kedudukan maya ❌
- Hit TP sementara hanya dijejaki sekali sahaja 🧷
🔁 Logik Pembatalan (Isyarat Bertentangan Semasa Aktif) ⚠️
Jika isyarat baru tiba semasa dagangan maya dalam arah bertentangan wujud:
- Kemasukan sebelumnya ditandakan sebagai DIBATALKAN ⚠️ (INV BELI / INV JUAL)
- Kedudukan maya sebelumnya ditamatkan 🧯
- Kedudukan maya baru dicipta dalam arah baru 🔄
🧼 Selamat Multi-Instans (Beberapa Salinan pada Carta Sama) 🧩🧩
Setiap instans penunjuk menjana ID dalaman unik 🆔, jadi:
- Garis/teks dari satu instans tidak akan menulis ganti instans lain ✅
- Anda boleh menjalankan beberapa konfigurasi secara selari (contoh, scalping + swing) 🧠📊
🧯 Kawalan Anti-Kekacauan (Had Penanda) 🧹✨
Untuk memastikan carta mudah dibaca, ia boleh:
- Hadkan bilangan penanda teks yang dilukis (BELI/JUAL/TP/SL/INV/TP1…) 🧾
- Padamkan penanda lama secara automatik apabila had terlampau ♻️
🧷 Pilihan “Simpan Garis Risiko Terakhir” 🧠📌
Apabila diaktifkan, garis Kemasukan/SL/TP terakhir kekal kelihatan walaupun selepas TP/SL ditutup:
- Sangat baik untuk semakan selepas dagangan 🧑🔬
- Sangat baik untuk pencatatan jurnal 📒✅
⚙️ Parameter — Penjelasan Terperinci (EN) 🔍📌
📈 Teras Isyarat & Risiko
⚡ EMA Pantas
- Apa yang dilakukannya 🧠: Menetapkan tempoh EMA pantas yang digunakan untuk mengesan peralihan regim.
- Kesan 📊: Nilai lebih rendah = lebih reaktif ➜ lebih banyak isyarat; lebih tinggi = lebih lancar ➜ kurang isyarat.
- Julat tipikal 🎛️: 3–10 untuk pasaran pantas ⚡, 10–20 untuk tetapan lebih tenang 🐢
🐢 EMA Perlahan
- Apa yang dilakukannya 🧠: Menetapkan tempoh EMA perlahan yang digunakan sebagai garis dasar tren.
- Kesan 📊: EMA perlahan lebih tinggi = penapisan lebih kuat ➜ kurang pencetus perubahan tren.
- Julat tipikal 🎛️: 13–55 bergantung pada gaya 🧭
🌡️ Tempoh ATR
- Apa yang dilakukannya 🧠: Mengawal panjang pengukuran volatiliti untuk ATR.
- Kesan 📏: ATR pendek bertindak balas cepat (SL lebih ketat), ATR panjang menstabilkan (SL lebih mantap).
- Julat tipikal 🎛️: 10–21 adalah biasa ✅
🛑 Pemboleh Ganda SL (ATR)
- Apa yang dilakukannya 🧠: Menentukan jarak Henti Rugi dalam unit ATR.
- Panjang 🟢:
SL = Low - ATR * Mult - Pendek 🔴:
SL = High + ATR * Mult - Kesan 🎯: Pemboleh ganda lebih tinggi = SL lebih luas (kurang henti, risiko lebih besar); lebih rendah = SL lebih ketat (lebih banyak henti).
- Nilai tipikal 🎛️: 0.3–2.0 bergantung pada volatiliti 🌪️
⚖️ Risiko:Ganjaran (R:R)
- Apa yang dilakukannya 🧠: Menggandakan jarak “risiko” untuk mengira TP akhir.
- Formula 📌:
-
- Risiko = |Kemasukan − SL|
- TP Akhir = Kemasukan ± Risiko × RR 🎯
- TP Sementara 🟢: TP1 pada 1R, TP2 pada 2R, … sehingga
floor(RR)-1 - Contoh 🧪: RR=3 ➜ TP1 (1R), TP2 (2R), TP Akhir (3R) 🎯🎯🎯
✅ Memerlukan pengesahan lilin
- Apa yang dilakukannya 🧠: Menambah pengesahan arah lilin pada bar isyarat.
- BELI 🟢: memerlukan Tutup > Buka
- JUAL 🔴: memerlukan Tutup < Buka
- Kesan 🧽: Menapis pembalikan lemah, mengurangkan bunyi, mungkin masuk lewat ⏳
📌 Paparan EMA
👁️ Tunjukkan EMA Pantas
- Apa yang dilakukannya 🧠: Menunjukkan/menyembunyikan garis EMA pantas.
- Kegunaan 💡: Sembunyikan jika anda mahu carta yang bersih 🧼
👁️ Tunjukkan EMA Perlahan
- Apa yang dilakukannya 🧠: Menunjukkan/menyembunyikan garis EMA perlahan.
- Kegunaan 💡: Kekal kelihatan untuk konteks tren 🧭
🎛️ Kawalan Visual (Pengurusan Kekacauan) 🧹✨
🚦 Tunjukkan Isyarat
- Apa yang dilakukannya 🧠: Menunjukkan/menyembunyikan penanda BELI/JUAL.
- Termasuk 🧷: Penanda BELI 🟢 / JUAL 🔴 sahaja
- Petua 💡: Nyahaktifkan untuk mod “garis sahaja” 📏
🏷️ Tunjukkan Label TP
- Apa yang dilakukannya 🧠: Menunjukkan/menyembunyikan label seperti TP1, TP2…
- Kesan 🧼: Mematikan mengurangkan banyak bunyi teks pada TF lebih tinggi 📉
- Nota 🧷: Label muncul hanya sekali setiap hit TP ✅
⚠️ Tunjukkan Tanda Pembatalan
- Apa yang dilakukannya 🧠: Menunjukkan/menyembunyikan penanda INV BELI / INV JUAL.
- Kegunaan 🧠: Berguna apabila anda mahu mengkaji pembalikan isyarat 🔁
🎯🛑 Tunjukkan Tanda TP/SL Akhir
- Apa yang dilakukannya 🧠: Menunjukkan/menyembunyikan penanda TP dan SL akhir.
- Kegunaan 📒: Sangat baik untuk menyemak taburan hasil 🎲
📏 Tunjukkan Garis Risiko (Kemasukan/SL/TP)
- Apa yang dilakukannya 🧠: Melukis garis Kemasukan 🏁, SL 🛑, TP Akhir 🎯 pada carta.
- Kesan 📌: Memvisualisasikan struktur dagangan maya dengan segera 🧠
🟢 Tunjukkan Garis TP Sementara
- Apa yang dilakukannya 🧠: Melukis garis putus-putus untuk tahap TP1/TP2/…
- Petua 🧼: Nyahaktifkan jika carta menjadi terlalu “spageti hijau” 🍝🟢
📌 Simpan Garis Risiko Terakhir
- Apa yang dilakukannya 🧠: Mengekalkan garis Kemasukan/SL/TP terakhir kelihatan selepas keluar maya (TP/SL).
- Mengapa ia berguna 📒: Sesuai untuk pencatatan jurnal & analisis selepas dagangan 🧑🔬✅
🧾 Maksimum Penanda Pada Carta (0=tanpa had)
- Apa yang dilakukannya 🧠: Mengehadkan berapa banyak objek teks yang ditinggalkan penunjuk pada carta.
- Bagaimana ia berfungsi ♻️: Apabila had terlampau, penanda tertua dipadam secara automatik.
- Disyorkan 🎛️: 80–200 bergantung pada jangka masa dan kedalaman sejarah 🕰️
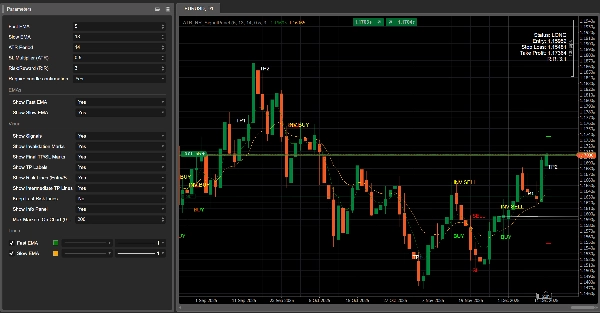
🧾 Tunjukkan Panel Maklumat
- Apa yang dilakukannya 🧠: Memaparkan panel status padat pada carta.
- Memaparkan 📋: Status (PANJANG/PENDEK/Tiada Kedudukan), Kemasukan, SL, TP, RR yang dikira.
Ringkasan
The indicator simulates virtual trades by setting entry price, stop loss, and take profit levels using Average True Range (ATR) for volatility-based risk sizing combined with a configurable risk-to-reward multiplier. It tracks intermediate take profit levels and monitors price action bar-by-bar to mark virtual trade outcomes without placing actual orders.
Key features include optional candle confirmation for signals, multi-instance support to run multiple configurations on the same chart, and visual clutter controls such as limiting markers and toggling display of EMAs, signals, and risk lines. An info panel provides a compact status overview of virtual positions. Parameters allow customization of EMA periods, ATR period, stop loss multiplier, and risk-reward ratio to adapt to different trading styles and market conditions.
Supported markets include Forex, indices, commodities, stocks, and cryptocurrencies, with symbols like GBPUSD, EURUSD, XAUUSD, NAS100, and BTCUSD among the tagged assets.
Ulasan pelanggan
5 | 100 % | |
4 | 0 % | |
3 | 0 % | |
2 | 0 % | |
1 | 0 % |


