
Penerangan
Imperium MTF Heatmap adalah penunjuk peringkat teratas yang unik untuk cTrader, dicipta untuk pedagang yang mahukan lebih daripada isyarat — mereka mahukan kawalan pasaran, kejelasan visual, dan nilai dagangan sebenar.
Penunjuk ini direka untuk mendedahkan struktur sebenar pergerakan pasaran jangka pendek dengan menggabungkan penjajaran pelbagai jangka masa, logik purata bergerak, kekuatan arah, dan tingkah laku pengesahan ke dalam satu sistem heatmap yang berkuasa.
Kelebihan terbesarnya bukan sahaja apa yang ditunjukkan, tetapi betapa cepat dan jelas ia ditunjukkan. Dalam pasaran yang pantas, keputusan mesti dibuat dengan segera. Imperium MTF Heatmap membantu anda mengenal pasti tekanan bullish dan bearish, mengesahkan kualiti momentum, dan mengesan penjajaran merentasi lapisan utama tanpa mengacaukan carta anda dengan bunyi yang tidak perlu.
Tetapan lalai dioptimumkan khusus untuk Tick30 dan Minute1, menjadikan penunjuk ini sangat berharga untuk pedagang aktif yang beroperasi dalam persekitaran berasaskan ketepatan yang pantas. Dari saat anda menggunakannya, ia sedia untuk berfungsi.
Ini adalah penunjuk premium dengan ketahanan sebenar.
Ia adalah jenis alat yang dengan cepat menjadi sebahagian daripada rutin dagangan anda kerana ia memberikan maklumat yang sukar diabaikan setelah anda melihatnya beraksi.
Banyak penunjuk digunakan untuk sementara waktu dan kemudian dikeluarkan.
Imperium MTF Heatmap berbeza.
Ia memberikan kelebihan visual yang praktikal dan segera sehingga secara semula jadi menjadi salah satu penunjuk yang anda terus gunakan setiap hari. Setelah ia ada pada carta anda dan anda mula membaca pasaran melalui penunjuk ini, berdagang tanpa ia terasa seperti kehilangan lapisan kesedaran yang penting.
Jika anda mahukan penunjuk yang unik, berkuasa, dan benar-benar berguna untuk dagangan Tick30 dan Minute1, Imperium MTF Heatmap adalah tepat itu.
Cara Menggunakan Imperium MTF Heatmap
Imperium MTF Heatmap direka untuk membantu anda membaca arah pasaran, kekuatan, dan penjajaran dengan cara yang pantas dan visual.
Daripada bergantung pada beberapa penunjuk berasingan, ia memberikan gambaran segera tekanan tren merentasi pelbagai lapisan.
Pada intinya, penunjuk menunjukkan sama ada pasaran condong ke bullish atau bearish, betapa kuat tekanan itu, dan sama ada baris yang berbeza sejajar. Ini memudahkan untuk mengesan keadaan dagangan berkualiti tinggi dan mengelakkan setup yang lemah atau bising.
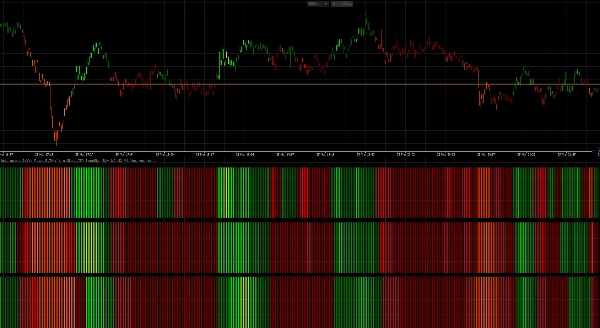
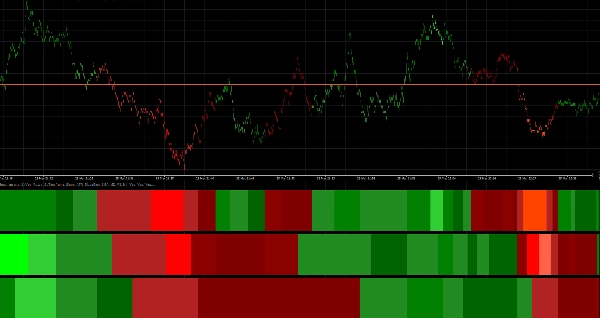
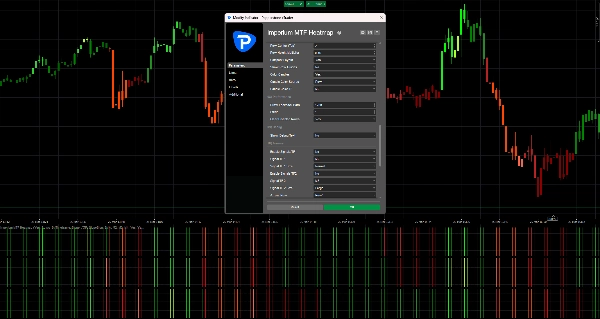
Apa yang ditunjukkan oleh heatmap
Heatmap dibina dengan 3 baris, dan setiap baris mewakili jangka masa berasingan atau lapisan purata bergerak bergantung pada susun atur anda.
- Zon hijau menunjukkan tekanan bullish
- Zon merah menunjukkan tekanan bearish
- Keamatan warna yang lebih cerah / kuat bermaksud momentum atau kekuatan tren yang lebih kuat
- Keadaan lemah atau tidak stabil kelihatan kurang kuat dan harus dirawat dengan lebih berhati-hati
Apabila beberapa baris sejajar dalam arah yang sama, pasaran biasanya mempunyai struktur yang lebih baik dan momentum yang lebih bersih.
Di situlah penunjuk menjadi sangat berharga.
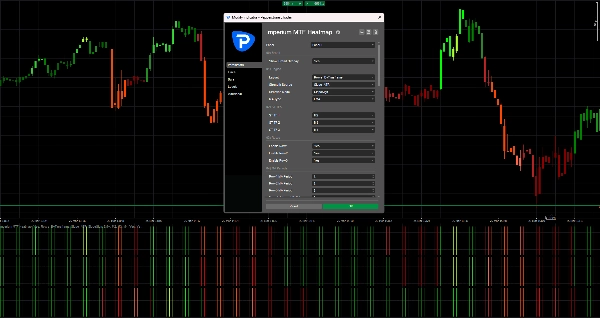
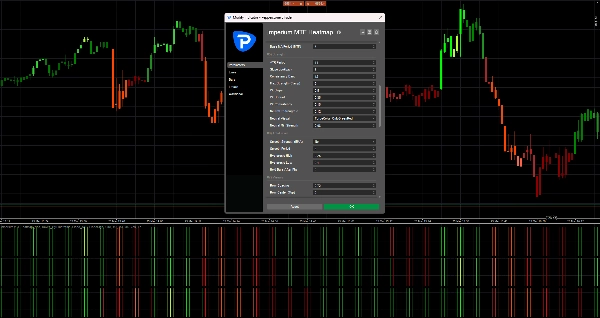
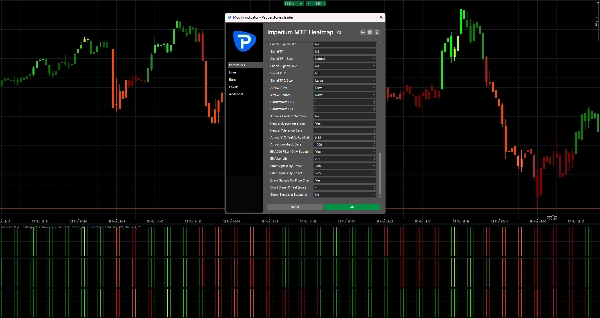
Tetapan lalai
Tetapan lalai dioptimumkan untuk:
- Tick30
- Minute1
Ini bermakna penunjuk sedia digunakan dengan segera untuk persekitaran dagangan yang pantas seperti scalping dan dagangan intraday jangka pendek.
Struktur lalai:
- Baris 1 = M2
- Baris 2 = M3
- Baris 3 = M4
Ini mencipta pandangan multi-jangka masa yang padat yang membantu anda menilai dengan cepat sama ada momentum jangka pendek disokong oleh lapisan seterusnya di atasnya.
Cara membaca penunjuk
1. Lihat Baris 1 dahulu
Baris 1 memberikan bacaan terpantas mengenai arah jangka pendek dan tekanan segera.
Gunakan Baris 1 untuk menjawab:
- Adakah momentum kini bullish atau bearish?
- Adakah terdapat tekanan aktif di pasaran sekarang?
- Adakah pergerakan itu kuat atau lemah?
Baris 1 adalah lapisan pertama maklumat, tetapi ia tidak selalu harus didagangkan secara sendiri.
2. Gunakan Baris 2 dan Baris 3 untuk pengesahan
Baris 2 dan Baris 3 bertindak sebagai penapis.
Jika Baris 1 berubah menjadi hijau tetapi Baris 2 dan Baris 3 kekal merah, pergerakan mungkin lemah, awal, atau hanya penarikan balik yang singkat.
Jika semua baris sejajar dalam arah yang sama, itu biasanya menandakan struktur yang lebih kuat dan kualiti dagangan yang lebih baik.
Peraturan umum:
- 1 baris sejajar = isyarat awal
- 2 baris sejajar = pengesahan lebih kuat
- 3 baris sejajar = konfluens arah berkualiti tertinggi
Cara terbaik menggunakannya dalam dagangan
Setup bullish
Setup bullish yang lebih kuat adalah apabila:
- Baris 1 berwarna hijau
- Baris 2 berwarna hijau
- Baris 3 berwarna hijau
- keamatan warna kukuh atau meningkat
- tindakan harga menyokong kesinambungan
Ini memberitahu anda bahawa tekanan bullish tidak terasing, tetapi disokong merentasi keseluruhan struktur heatmap.
Setup bearish
Setup bearish yang lebih kuat adalah apabila:
- Baris 1 berwarna merah
- Baris 2 berwarna merah
- Baris 3 berwarna merah
- keamatan warna kukuh atau meningkat
- tindakan harga menyokong kesinambungan ke bawah
Ini mencadangkan kawalan bearish dan kebarangkalian lebih baik untuk entri pendek atau dagangan kesinambungan.
Pendekatan dagangan praktikal
Cara mudah menggunakan Imperium MTF Heatmap:
Gaya kemasukan agresif
Masuk apabila:
- Baris 1 berubah dengan kuat
- Baris 2 mula menyokong pergerakan
- momentum berkembang dengan cepat
Gaya ini memberikan kemasukan lebih awal, tetapi juga risiko lebih tinggi.
Gaya kemasukan konservatif
Masuk hanya apabila:
- Baris 1, Baris 2, dan Baris 3 sejajar
- warna stabil dan kuat
- pergerakan disokong oleh tindakan harga yang bersih
Gaya ini memberikan kemasukan yang lebih sedikit, tetapi seringkali berkualiti lebih baik.
Pewarnaan lilin
Penunjuk juga boleh mewarnakan lilin berdasarkan arah heatmap.
Ini membantu anda:
- tetap sejajar secara visual dengan bias semasa
- mengelakkan dagangan bertentangan dengan tekanan aktif
- membaca pasaran dengan lebih cepat tanpa memeriksa setiap baris secara manual
Dengan tetapan lalai, pewarnaan lilin dihubungkan dengan M2, yang sesuai dengan logik dagangan pantas carta Tick30 dan Minute1.
Anak panah isyarat
Jika diaktifkan, anak panah isyarat boleh membantu menonjolkan peluang beli dan jual yang berpotensi.
Anak panah ini tidak dimaksudkan untuk menggantikan pembacaan pasaran.
Ia berfungsi terbaik apabila digunakan bersama penjajaran heatmap.
Amalan terbaik:
- Gunakan anak panah hanya dalam arah bias heatmap penuh
- Berikan lebih nilai kepada anak panah apabila Baris 2 dan Baris 3 mengesahkan Baris 1
- Abaikan anak panah semasa keadaan heatmap bercampur atau bertentangan
Dalam tetapan lalai anda sekarang, anak panah isyarat dimatikan off, yang menjadikan carta bersih dan memberi tumpuan kepada heatmap itu sendiri.
Apa yang perlu dielakkan
Jangan gunakan penunjuk secara membuta tuli.
Elakkan mengambil dagangan apabila:
- baris bercampur
- warna lemah dan tidak stabil
- arah heatmap berubah dengan cepat
- pasaran bergelora atau terikat julat
- tindakan harga jelas tidak sehaluan dengan struktur heatmap
Penunjuk paling kuat apabila digunakan sebagai alat sokongan keputusan, bukan sebagai sistem auto-masuk berdiri sendiri.
Kes penggunaan terbaik
Imperium MTF Heatmap sangat berkesan untuk:
- scalping
- dagangan momentum jangka pendek
- entri kesinambungan tren
- pengesahan penarikan balik
- analisis konfluens pelbagai jangka masa
- penapisan dagangan lemah
- tetap sejajar dengan tekanan pasaran
Mengapa pedagang terus menggunakannya
Penunjuk ini menjadi berkuasa kerana ia memampatkan banyak maklumat penting pasaran ke dalam satu bacaan visual yang pantas.
Setelah anda mula menggunakannya secara berkala, anda mula menyedari:
- arah dengan lebih pantas
- kekuatan dengan lebih jelas
- penjajaran dengan lebih yakin
- setup lemah lebih awal
- masa yang lebih baik dalam pasaran aktif
Itulah sebabnya ia sering menjadi salah satu penunjuk yang pedagang sentiasa simpan pada carta mereka.
Peraturan mudah untuk diingati
Penjajaran hijau = cari beli
Penjajaran merah = cari jual
Heatmap bercampur = tunggu
Prinsip tunggal itu sudah menjadikan penunjuk sangat praktikal.
Ringkasan
Traders use the heatmap to quickly assess market direction, momentum quality, and alignment across multiple layers, aiding in identifying high-quality trade setups and filtering out weak or noisy conditions. The indicator supports both aggressive and conservative entry styles based on the alignment and strength of the heatmap rows. It can also color candles according to the dominant heatmap direction for faster market reading.
Optional signal arrows highlight potential buy and sell opportunities but are intended as a supplement to heatmap analysis rather than standalone signals. Imperium MTF Heatmap is particularly suited for scalping, short-term momentum trading, trend continuation, pullback confirmation, and multi-timeframe confluence analysis across various markets including Forex, indices, commodities, stocks, and cryptocurrencies. It functions as a decision support tool to enhance market awareness and timing in active trading environments.
Ulasan pelanggan
5 | 50 % | |
4 | 50 % | |
3 | 0 % | |
2 | 0 % | |
1 | 0 % |


![Logo "Wyckoff Toolkit [Iridio Capital]"](https://cdn.ctrader.com/image/webp/8acfe6a1-6a8e-4578-9367-9df3af2b1801_27763)


