Beschreibung
Order Block - Marktstruktur-Signale
Dieses leistungsstarke Instrument, entwickelt von professionellen Händlern, hat seine Wirksamkeit bereits auf echten Handelskonten bewiesen.
Hauptvorteile:
- Vielseitigkeit: funktioniert bei allen Instrumenten, Märkten und Zeitrahmen (Forex, Krypto, Aktien, Anleihen, Futures).
- Präzision: zeigt die besten Ergebnisse auf Tick-Charts, indem schnelle Impulse während starker Marktbewegungen herausgefiltert werden. Funktioniert auch gut auf Standard-Zeitrahmen.
- Flexibilität der Einstellungen: ermöglicht es, den Indikator an Ihren Handelsstil und Ihre Vorlieben anzupassen.
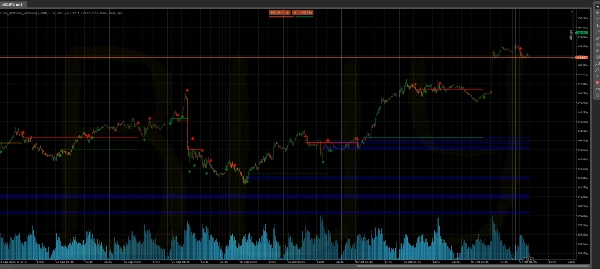
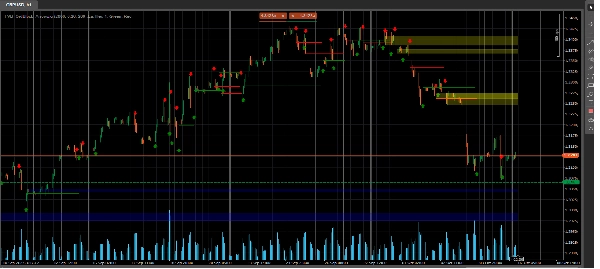
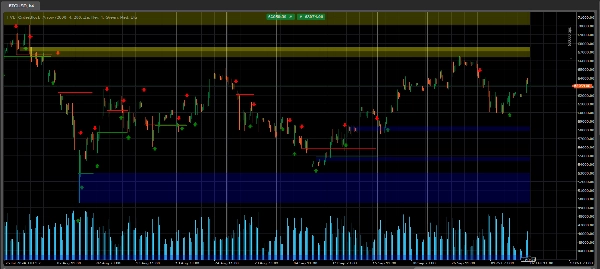
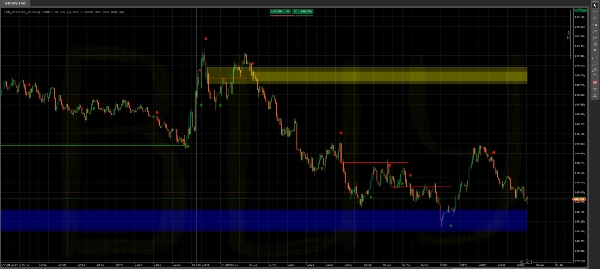
- Visuelle Klarheit: zeigt deutlich die Ebenen des Marktstrukturbruchs, Signale sowie Unterstützungs-/Widerstandsbereiche (OrderBlock) an.
Hauptfunktionen:
- Dynamische Berechnung und Anzeige der OrderBlock-Zonen
- Einstiegssignale (rote und grüne Pfeile)
- Anzeige der wahrscheinlichen zukünftigen Trendbewegung (optional)
- Einstellbare Blocktransparenz
- Option zum Entfernen abgeschlossener Zonen
Berücksichtigen Sie stets den Marktkontext!
Einstellungen:
Bars History - Anzahl der Balken für die Berechnung (bei zu vielen kann der Computer belastet werden). Standard sind 2000 Balken.
Deviation % Zigzag - Hauptparameter - Berechnung basierend auf Zigzag. Wird je nach Zeitrahmen und Instrument angepasst Block
Transparenz 0-250 - Transparenz der Blöcke Delete Old/Broken Boxes - ob alte Blöcke gelöscht werden sollen
Delete Arrows - Signalpfeile nicht anzeigen Arrow Distance (ATR multiplier) - Abstand vom Balken zum Pfeil in ATR ........
Delete Dots - Deaktiviert das Zeichnen von Punkten (umstrittene Funktion - Punkte zeigen wahrscheinliche zukünftige Trendbewegung)
Im Chart: Rote und grüne Linien - Ebenen des Marktstrukturbruchs Rote und grüne Pfeile - Indikatorsignal Bänder - OrderBlock-Zonen - Unterstützung und Widerstand. Sie werden dynamisch berechnet und bei Abschluss entfernt (Option, sie im Chart zu behalten)
Wichtig: Der Indikatorcode ist urheberrechtlich geschützt.
Zusammenfassung
Kundenbewertungen
5 | 50 % | |
4 | 0 % | |
3 | 50 % | |
2 | 0 % | |
1 | 0 % |