说明
- 该指标的功能
该指标将两个独立的分析引擎合并为图表上的单一叠加层。第一个——平滑Z分数——将每个柱状图分类为统计状态(牛市、熊市或中性),并相应地着色。第二个——振幅动量(AMP)检测器——通过测量累计收益并用回归分析验证,识别持续的方向性价格序列。
两者结合,生成一个图表,同时显示市场的统计环境和动量结构,无需您解释单独的振荡器面板或手动画图。
更多详情请参阅cBot版本页面。
- 两个分析层
- 层1——Z分数状态分类
Z分数衡量当前价格距离其近期统计中心的偏离程度,以标准差表示。当该偏差超过有意义的阈值时,指标宣布一个方向性状态已开始。
这与“价格是否上涨?”是根本不同的问题——它问的是“价格是否已远离均衡点,发生了结构性的重要变化?”
有三种状态:
牛市状态——价格显著高于其滚动统计中心。图表显示为绿色。
熊市状态——价格显著低于其滚动统计中心。图表显示为红色。
中性——价格处于正常波动范围内。指标在此并非简单静默,而是进入合成趋势模式,继续将每个中性柱分类为偏向牛市或熊市(详见下文)。
- 层2——AMP序列检测
AMP层分析累计价格收益(以基点计)并识别动量序列——价格进行持续且有意义方向性移动的时期。
检测分两遍进行。第一遍扫描价格收益,寻找超过最小振幅阈值的方向性移动,标记反转、回撤和不活跃期。第二遍应用OLS(普通最小二乘)回归细化——从两端拟合回归线,修剪不满足振幅要求的区域。这样消除价格技术上移动足够但波动噪声大或不令人信服的假阳性。
图表上可见多种AMP状态:
上升序列进行中——价格正在进行持续且有意义的向上移动。
下降序列进行中——价格正在进行持续且有意义的向下移动。
序列结束——确认的动量序列刚刚完成。图表上以三角形标记。这表示先前的方向推动已耗尽。
发展中序列——在实时(形成中)柱上,检测到新序列但尚未由闭合柱确认。用不同颜色显示,便于区分暂定和确认读数。
中性——无足够振幅的方向性动量。
- 两个层如何协同工作
Z分数告诉你市场处于何种统计状态——价格是否偏离其常态以构成某种状态,或是否在正常范围内波动。
AMP层告诉你价格当前的实际动态——方向性动量序列是否正在运行、刚结束或尚未开始。
单独任何一层都无法提供完整画面。Z分数牛市状态确认统计环境偏向上涨,但不说明动量是否活跃或暂停。AMP上升序列确认价格有力移动,但不说明该移动相对于近期行为是否统计显著。
当两层一致时,你获得对市场状况的更高质量解读。配套交易机器人正是基于此原则——仅当Z分数状态、AMP序列状态和方向性偏差过滤器同时对齐时才开仓。
- 信号标记和序列结束标记
指标在图表上多个事件类型处放置视觉标记:
Z分数状态开始标记出现在确认新牛市或熊市状态的确切柱上,告诉你统计环境何时发生变化。
中性交叉标记出现在价格穿越中性阶段合成趋势线时。牛市交叉表示价格已突破预测的状态趋势线;熊市交叉表示价格跌破该线。这些标记识别中性区内的结构性拐点。
AMP序列结束标记以三角形显示在确认的动量序列最后一个柱上。向上三角标记上升序列结束;向下三角标记下降序列结束。这些点表示方向推动已被确认耗尽——通常是图表上最具操作价值的入场和退出时机信息。
所有标记类型均可触发弹出和声音提醒。
- OLS细化——为何AMP序列值得信赖
许多动量检测器仅测量窗口内的价格变化。AMP层更进一步。在初步检测识别候选序列后,使用普通最小二乘回归对每个检测区域进行验证——这也是正式统计分析中使用的方法。
回归从两个方向应用(从序列开始向前,从序列结束向后),保留最大验证范围。任何回归斜率不满足最小振幅要求的序列部分都会被修剪。剩下的是方向性已被数学确认的序列,而非仅凭原始价格波动假设。
这种两遍方法使AMP序列比简单动量振荡器更为干净。过滤掉了因震荡横盘引起的假阳性。仅保留具有真实、回归验证方向力的移动。
- 稳健统计——内置抗异常值能力
标准Z分数使用均值和标准差,这两者对异常值极为敏感。单个极端蜡烛(新闻冲击、闪崩)会扭曲均值并膨胀标准差,导致随后许多柱出现误导性读数。
该指标提供了使用中位数和MAD(中位数绝对偏差)的替代统计模式。这些度量本质上抗异常值——单个极端值不会拉动中心或膨胀分布。
在易受突发冲击影响的市场(新闻驱动工具、流动性稀薄期),稳健统计能显著提升状态检测质量。这不是表面选项,而是信号质量的结构性改进。
- 影响力——控制状态如何适应
在活跃的Z分数状态期间,使用称为影响力的参数将新价格值混入滤波序列。这控制当前价格在状态期间对滚动统计窗口的影响程度。
一端,状态的统计中心完全忽略新价格,保持其原始参考框架——有助于检测价格何时相对于移动起点最终耗尽。另一端,中心完全适应新价格,只有相对于最新行为的新偏差才会触发或维持状态。
这不是传统意义上的平滑参数。它控制状态本身的记忆——指标内部参考框架调整以适应持续移动现实的速度。
- 信号边际——防止闪烁的滞后效应
基于阈值的指标最常见的问题之一是闪烁:价格在阈值附近徘徊,信号快速在激活和非激活间切换。
该指标通过内置滞后机制解决此问题。一旦状态激活,维持该状态的有效阈值会降低一个可配置的边际。启动状态需要更大力度,而维持状态则较易。一旦市场确定方向,指标保持该读数,直到出现真正反转——而非边界附近的噪声。
- 实时检测——形成柱上的实时AMP读数
大多数基于序列的指标仅在柱关闭时更新。AMP层包含实时检测模式,运行完整算法包括形成中(实时)柱,实时读取新序列是否正在发展,尚未确认。
发展中序列用不同颜色显示,便于区分确认读数和暂定读数。这让你能尽早察觉动量变化,同时保持确认信号的完整性。
- 确认——两层的可选延迟
两个分析层都支持可选确认要求:
对于Z分数,可以配置连续多根柱超过阈值后才确认状态。信号标记放置在确认完成的确切柱上,而非首次越过阈值的柱。
对于AMP层,序列结束可要求序列结束后有配置数量的非恢复柱,才确认结束。这防止序列短暂停止后又恢复时过早标记结束。
两者都以可靠性换取时效性。在震荡条件下,即使多一根确认柱也能消除大多数假启动。
- 该指标的独特之处
大多数图表指标只提供单一维度——趋势强度、动量或波动率。你需要交叉参考多个面板,自行拼凑画面。
该指标提供两个独立分析维度的单一叠加层。Z分数告诉你市场的统计状态。AMP层告诉你该状态内动量的表现。两者共同回答最重要的两个问题:市场是否处于有意义的移动中,该移动是否仍在进行?
合成趋势线系统意味着你永远不会处于信息真空。即使在最安静的中性阶段,指标也提供来自最近有意义状态的方向参考。
OLS回归细化意味着你在图表上看到的动量序列已被数学验证,而非仅从嘈杂的价格行为推断。
使用稳健统计、信号滞后和双层确认意味着该指标设计用以抵抗最常见的失败模式:异常值敏感、边界闪烁、假突破和过早的序列结束信号。
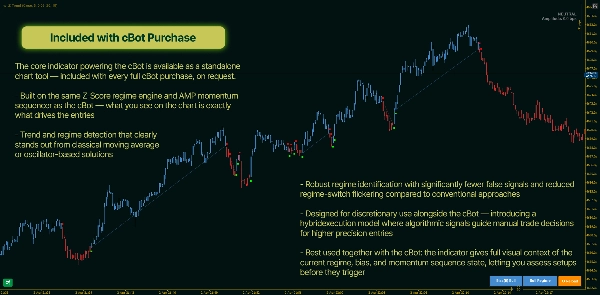
最后,该指标设计为基础层。其状态和序列输出直接被配套交易机器人使用,后者要求Z分数状态、AMP序列状态和方向性偏差过滤器对齐后才执行交易。该指标不是独立信号生成器,而是为真实资金构建的多层决策系统的分析骨干。
- 状态显示
AMP层包含一个图表上的状态面板,显示当前动量状态和活动序列的振幅(以基点计)。面板实时更新,并为每种状态使用不同颜色——活动上升序列、活动下降序列、发展中序列、序列结束和中性——使当前状态一目了然,无需检查单个柱。
摘要
This dual-layer approach enables simultaneous visualization of the market’s statistical state and active momentum sequences directly on the price chart, eliminating the need for separate oscillator panels. The indicator marks regime starts, neutral crossovers, and momentum sequence ends with visual symbols, which can trigger alerts. It supports live detection of developing sequences on the forming bar and offers configurable confirmation delays to improve signal reliability. An on-chart status panel displays real-time momentum states and sequence amplitudes.
Designed as a foundational analytical tool, wt.Z-Trend’s outputs are used by a companion trading bot that requires alignment of regime, momentum, and directional bias before placing trades. It supports multiple markets including Forex, indices, cryptocurrencies, and XAUUSD.
客户评价
5 | 100 % | |
4 | 0 % | |
3 | 0 % | |
2 | 0 % | |
1 | 0 % |