
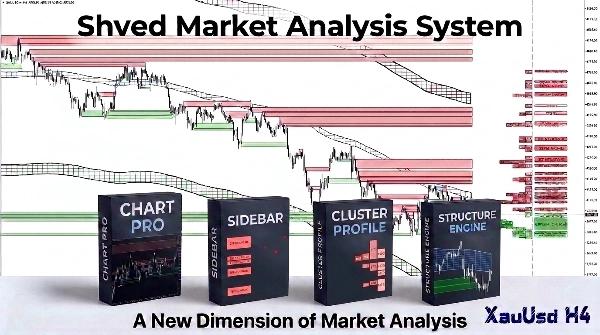
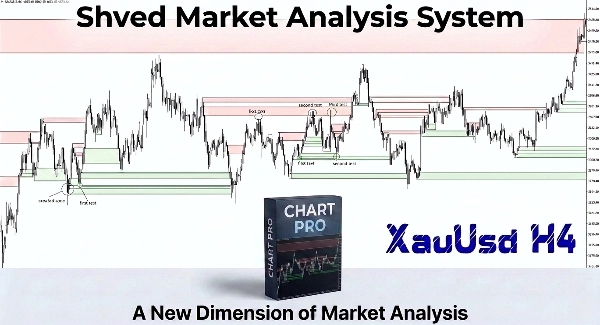

说明
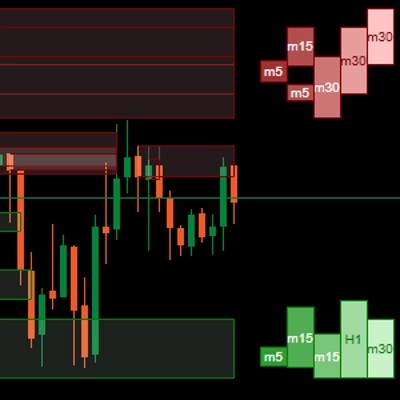
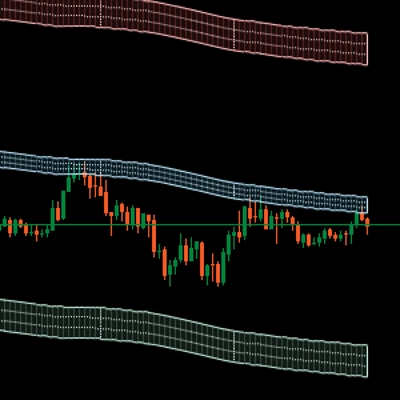
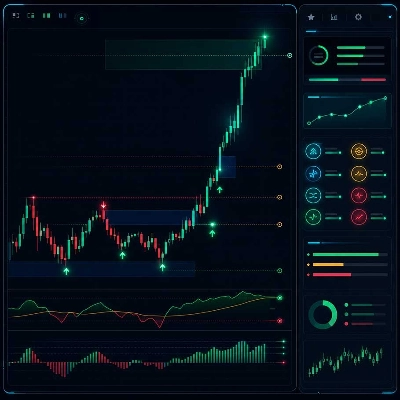
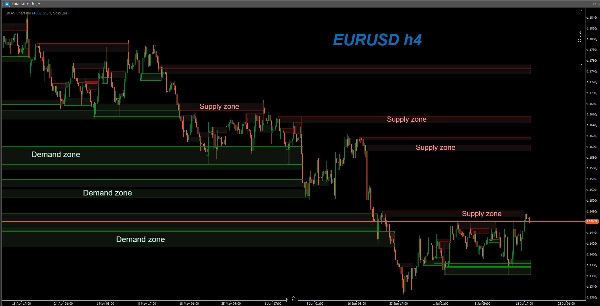
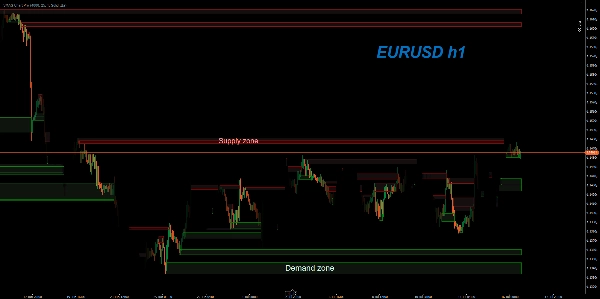
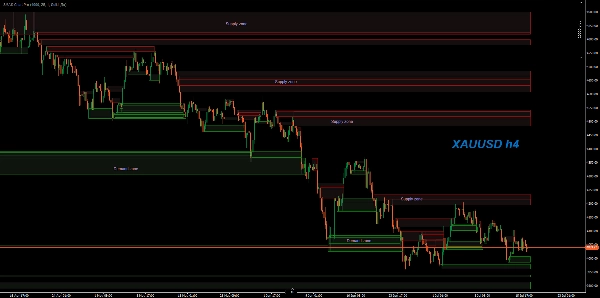
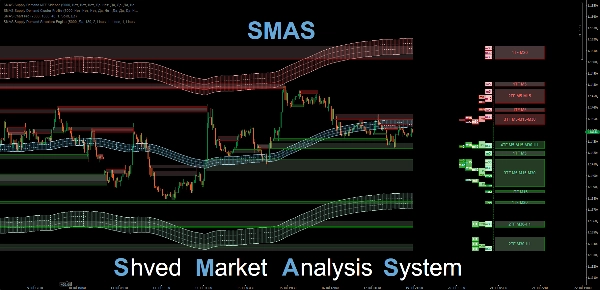
SMAS Chart Pro 指标是 Shved 市场分析系统(SMAS)的重要组成部分。它是 cTrader 平台的专业分析工具,旨在自动检测和动态跟踪价格图表上的强大供需区。
该指标基于专有的 Shved 供需算法,受到全球数千名交易者的信赖。cTrader 的专业版采用全新设计的高科技区检测算法,使用 C# 编写,并针对 cTrader Automate 架构进行了深度性能优化。
该指标高度多功能:得益于先进的代码优化,它非常适合日内剥头皮交易(M1 和 M5 时间框架)以及长期的头寸交易或投资(H4、日线及更高时间间隔)。
cTrader 版本的主要优势:
- 受保护的专有算法:所有基础检测比例自动适用于任何资产。参数隐藏在代码中以保护知识产权。
- 区域不透明度调整:自定义参数允许您调整区域填充的透明度(推荐值在 25 到 40 之间)。这确保了在浅色和深色图表主题下,您的蜡烛图和网格线保持清晰。
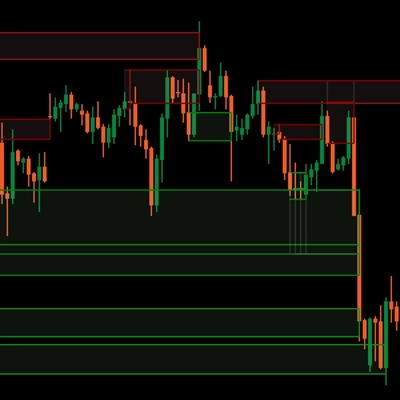
- 动态缓解跟踪:区域保持激活状态并向右延伸,直到价格突破其极限边界(“突破双层级”规则)。一旦价格完全吸收限价障碍,该级别即被停用。
- 历史测试与反应视图:您可以启用显示已破坏区域(显示无效区域)。它们以细线形式保留在图表上,颜色随基础变化,便于您直观分析历史反弹。
- 高性能:代码采用纯净的 C# (.NET) 编写,基于定时器的去抖动,确保图表即时加载,即使在 M1 时间框架上也无延迟。
交易建议:
供需区是寻找低风险入场点的理想区域,适用于级别重新测试。止损通常设置在基础的相反外边界之外,确保止损紧凑且交易风险/回报比高。
==================================================
俄语翻译 / RUSSIAN VERSION
==================================================
Индикатор SMAS Chart Pro является важной частью торговой системы Shved Market Analysis System (SMAS). Это профессиональный аналитический инструмент для платформы cTrader, предназначенный для автоматического поиска и динамического ведения сильных зон спроса и предложения (Supply & Demand) непосредственно на вашем ценовом графике.
Этот индикатор создан на базе оригинального алгоритма Shved Supply and Demand, который завоевал доверие тысяч трейдеров. Версия Pro для cTrader получила полностью переработанный, высокотехнологичный алгоритм поиска зон, написанный на C# с глубокой оптимизацией производительности под архитектуру cTrader Automate.
Индикатор универсален: благодаря оптимизации кода он подходит как для внутридневного скальпинга (на таймфреймах M1 и M5), так и для долгосрочного позиционного трейдинга и инвестирования (на H4, Daily и старших интервалах).
Оригинальный алгоритм фильтрации шума:
Главное отличие индикатора от большинства стандартных программ заключается в его математическом ядре сканирования. Стандартные индикаторы часто отмечают любые случайные развороты цены или фракталы. SMAS Chart Pro использует фильтр рыночного шума: он оценивает скорость и импульс резкого выхода цены относительно размера и волатильности самого диапазона накопления ордеров.
Алгоритм математически вычисляет, был ли ценовой разворот результатом институциональной проторговки с нереализованным лимитным объемом или это обычный хаотичный шум. Это позволяет отсеивать слабые уровни, оставляя на графике только те зоны, от которых цена с высокой вероятностью получит сильную реакцию.
Модели поиска Price Action:
Алгоритм сканирует график на предмет формирования четырех классических моделей Price Action:
- Rally-Base-Rally (RBR) и Drop-Base-Rally (DBR) — для зон спроса (покупок / Demand).
- Drop-Base-Drop (DBD) и Rally-Base-Drop (RBD) — для зон предложения (продаж / Supply).
Каждый паттерн строго оценивается по пропорциям силы первоначального импульса, размера и длительности ценовой консолидации, а также скорости последующего выхода цены из этого диапазона.
Ключевые преимущества версии для cTrader:
- Защищенный авторский алгоритм: Все пропорции поиска баз настроены профессионально и работают автоматически на любых инструментах. Параметры скрыты внутри кода для защиты интеллектуальной собственности.
- Регулировка прозрачности (Zone Opacity): Специальный параметр позволяет настроить прозрачность заливки зон (рекомендуемое значение — от 25 до 40). Это позволяет сохранить полную четкость свечей и сетки графика на любой теме терминала (светлой или темной).
- Динамическое ведение зон (Mitigation): Зона остается полностью активной и продлевается вправо, пока цена не пробьет её экстремум (правило Break Both Levels). Как только цена полностью поглощает лимитный барьер, уровень деактивируется.
- История тестов и реакций: Вы можете включить отображение пробитых зон (Show Invalid Zones). Они останутся на графике в виде тонких линий, изменив цвет на цвет базы, что позволит наглядно оценивать историю отскоков.
- Высокая производительность: Код написан на чистом C# (.NET) и оптимизирован для стабильной работы даже при анализе глубокой истории баров.
摘要
Key features include automatic zone detection with protected algorithm parameters, adjustable zone opacity for clear visualization on different chart themes, and dynamic mitigation tracking where zones remain active until price breaks their boundaries. It also offers a historical view of broken zones to analyze past price reactions. The algorithm filters market noise by evaluating price impulse strength, consolidation size, and volatility to highlight only significant zones likely to influence price action.
The indicator scans for four classic Price Action patterns—Rally-Base-Rally, Drop-Base-Rally, Drop-Base-Drop, and Rally-Base-Drop—to identify demand and supply zones. These zones serve as potential entry points with defined stop loss placement beyond opposite boundaries, aiming for favorable risk/reward ratios. SMAS Supply Demand Chart Pro is designed for use on any asset and integrates smoothly within the cTrader Automate environment.