

Описание
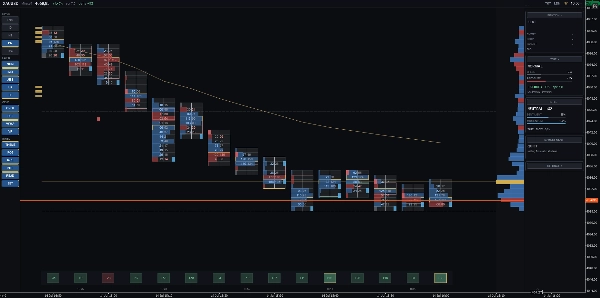
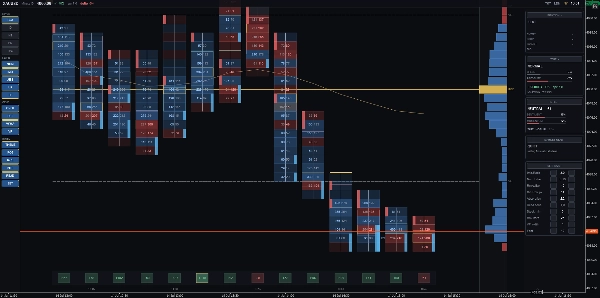
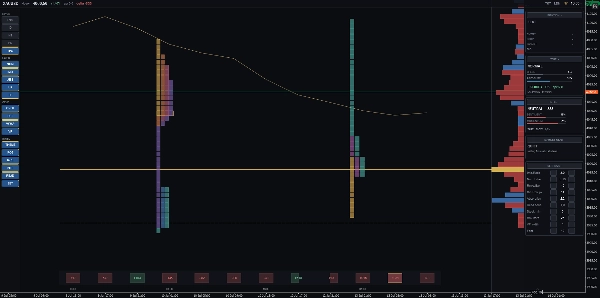
DRX OrderFlux превращает тиковые данные в чистую диаграмму потока ордеров, показывая, где замедляется импульс и какие уровни аукцион повторно тестирует. ЧТО ОН РИСУЕТ - След отпечатка Bid x Ask: Разделён по ценовым уровням с активностью покупок и продаж рядом друг с другом. Пять видов: Bid x Ask, Delta, Heatmap, Profile и TPO. - Дисбалансы и накопленные стены: Выделяет ценовые уровни, где дисбаланс объёмов превышает выбранное вами соотношение. - Абсорбция и незавершённые аукционы: Обнаруживает высокую активность, не способную продвинуть цену дальше, а также экстремальные уровни, закрывающиеся неполностью. - Одинарные отпечатки: Выделяет ценовые уровни, кратковременно посещённые перед быстрыми отскоками. - Профиль объёма: Отображается в панели, закреплённой на правом краю, с POC, VAH, VAL и сессионным VWAP. - Временные блоки TPO: Один профиль на сессию с выделенным POC, цветовой кодировкой по хронологии. - Дельта-лента: Расположена внизу на одной линии для прямого сравнения. - Чтение рынка: Ненавязчивые сигналы, появляющиеся при явных отскоках или прорывах объёма. Пороги автоматически самокалибруются для каждого символа. - Панель ленты: Измеряет текущую скорость ленты относительно средних уровней и выдаёт предупреждения о ликвидности. - Панель позиций: Отображает вход, стоп, цель, PnL и соотношение риск/вознаграждение с чёткими линиями на графике. Настройки макета сохраняются автоматически для каждого символа и таймфрейма. КАК ИСПОЛЬЗОВАТЬ Совместим со всеми символами и таймфреймами. Идеален для внутридневного анализа (M1 до H1). Работает вместе с DRX Footprint Lower для выделенных панелей объёма, дельты и кумулятивной дельты. О ДАННЫХ Тиковые данные cTrader включают время, котировки bid и ask, но не передают данные о размере сделок. DRX OrderFlux измеряет активность тиков, а не объём торгуемых контрактов, следуя стандартной методологии тикового объёма FX. Данные глубины рынка зависят от поставщиков брокера. Большинство CFD-счётов предоставляют ограниченные агрегированные уровни; поэтому предупреждения о ликвидности интегрированы в панель ленты, а не в лестницу книги ордеров.
Сводка
Key features include five distinct views: Bid x Ask footprint, Delta, Heatmap, Volume Profile, and TPO (Time Price Opportunity). The indicator highlights imbalances and stacked walls where one side dominates, absorption zones where heavy activity fails to move price, unfinished auctions, and single prints—levels touched only once. The volume profile panel shows POC (Point of Control), VAH (Value Area High), VAL (Value Area Low), and session VWAP. TPO profiles per session are color-coded to compare auction shapes across days.
Additional tools include a delta lane for comparing bars, a market read panel that signals price rejections or breaks with volume and delta confirmation, a tape panel showing tape speed and liquidity warnings, and a position panel displaying entry, stop, target, PnL, pips, and risk-reward ratio. Layouts are saved per symbol and timeframe for consistent workspace setup.
DRXFootprint uses cTrader tick data, measuring tick activity rather than traded contract volume, and includes liquidity warnings based on broker depth of market data.
Отзывы покупателей
Обсуждение
Частые вопросы


![Логотип продукта "Session Volume Profile (SVP) [Iridio Capital]"](https://cdn.ctrader.com/image/webp/b058beb7-b143-45f3-87d0-8c524c00b203_61552)













Цена
