Trading product for Bubble Indicator 2.0 Indicator Breakout Scalping, image 1
Indicator
7 purchases
Version 1.0, Feb 2026
Windows, Mac
4.3
Reviews: 3
Trading product for Bubble Indicator 2.0 Indicator Breakout Scalping, image 2
Since 10/01/2026
7
Sales

Description

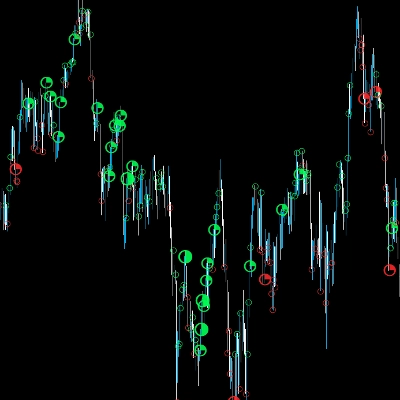
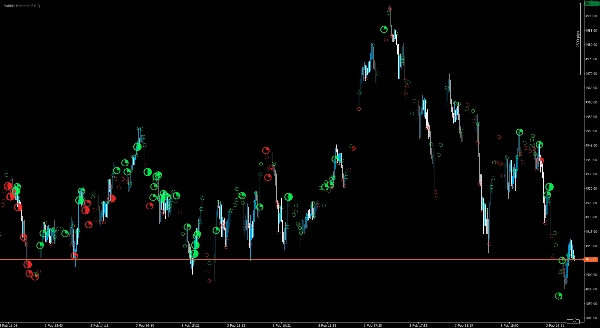
Delta Peak Bubbles is built for traders who want a fast, visual way to identify “where the market is doing the work” on tick charts. Instead of cluttering your screen with extra panels, it draws clear, graded bubbles directly on the chart to reveal high‑intensity bursts of activity in real time.

The indicator focuses on peak moments within each bar and visualizes them with an easy‑to-read strength scale (from subtle circles up to a standout star for the strongest events). Bubbles are color‑coded for quick directional context, making it simple to distinguish bullish vs. bearish pressure at a glance.

Designed for practical trading workflows, Delta Peak Bubbles works especially well for:

  • Scalping and short‑term momentum trading
  • Breakout confirmation and impulse tracking
  • Identifying reaction zones and potential exhaustion points
  • Adding a “heat layer” to Price Action / SMC / key level strategies

Bubble strength guide

Bubbles are graded into four strength levels to help you quickly separate normal activity from high‑impact spikes:

  • Level 1 – Low:  (minor spike)
  • Level 2 – Medium:  (moderate spike)
  • Level 3 – High:  (strong spike)
  • Level 4 – Extreme:  (very strong / standout spike)

Color indicates directional pressure (green = bullish, red = bearish).

Display controls make it clean on any layout, including 4K monitors, so you can keep your chart readable while still seeing the important moments.

Disclaimer: Trading/Investing involves substantial risk and may result in the loss of all invested capital. This indicator is provided for informational and analytical purposes only and does not constitute financial advice, an offer, or a recommendation. Use is at your own risk; you remain solely responsible for all trading decisions and outcomes. The provider makes no representations or warranties (express or implied) regarding accuracy, completeness, timeliness, performance, merchantability, or fitness for a particular purpose. To the fullest extent permitted by law, the provider shall not be liable for any direct or indirect losses, damages, or lost profits arising from or related to the use of this indicator (including, without limitation, losses due to market conditions, data/platform issues, configuration errors, or misuse). Past performance is not a reliable indicator of future results.

Summary

AI summary
Bubble Indicator 2.0 is a tick-chart overlay indicator designed for the cTrader platform that visually highlights strong momentum spikes in real time. It displays graded bubbles directly on tick charts to indicate peak moments of market activity, using a four-level strength scale from minor (Level 1) to extreme spikes (Level 4). The bubbles are color-coded—green for bullish pressure and red for bearish—to provide immediate directional context. This indicator is suited for scalping, short-term momentum trading, breakout confirmation, impulse tracking, identifying reaction zones, and enhancing price action or smart money concept strategies. Display controls ensure clarity on various screen layouts, including 4K monitors, by keeping the chart readable while emphasizing significant market moves.
Indicator profile

Customer reviews

4.3
Reviews: 3
5
33 %
4
67 %
3
0 %
2
0 %
1
0 %
Customer reviews
February 6, 2026
Calm decision layer for traders who combine signals before acting. It gives value around chart reading, but it should not be used as a blind entry trigger. The cleaner reads should hold across 3 sessions, not just 1 good chart. It is stronger when a 1.5R target is realistic before the entry.
February 5, 2026
February 5, 2026
Measured chart review for chart reading. it makes market context easier to scan, especially when used for adding confirmation before a trade. I would test it on 2 timeframes, 20 signals and a 1R stop plan. It is stronger when a 1.5R target is realistic before the entry.

Discussion

FAQ

Breakout
Scalping
SMC
Products available through cTrader Store, including trading bots, indicators and plugins, are provided by third-party developers and made available for informational and technical access purposes only. cTrader Store is not a broker and does not provide investment advice, personal recommendations or any guarantee of future performance.

You may also like

Indicator
RSI
Breakout
+1
📊 Liquidation Map: Potential areas where highly leveraged investors might face liquidations.
Indicator
Drawdown Monitor
Proprietary trading desk risk monitoring dashboard!
Indicator
AI
ATR
+27
The Fibonacci Automated Levels Indicator is a smart trading tool that automatically detects the most recent market.
Indicator
SMC
Grid
+19
Smart fractals + auto Fibonacci + dynamic S/R zones with HTF confluence & Bull/Bear bias panel. Institutional-grade.
Indicator
Signal
Trades Opening Range Breakouts Indicator with dynamic stops/targets adapting to market volatility.
Indicator
AI
ATR
+19
Market Cipher A
Indicator
Order Block
Supply & Demand
+2
Professional MTF dashboard aggregating and clustering Supply & Demand zones from multiple timeframes in cTrader.
Indicator
Forex
BTCUSD
+12
Pro Structure Patterns Detector
Indicator
Channel
Order Block
+2
Advanced structural market channel built from Supply & Demand zones. Part of the SMAS ecosystem.
Indicator
ATR
Order Block
+5
Automated FVG & Order Block mapping with built-in trade playbook HUD & zero-lag performance.
Indicator
VWAP
Volume
+4
Volume Profile + VWAP with Standard Deviations
Indicator
VWAP
Volume
+2
VWAP Stdev Heatmap: Advanced daily VWAP with 5-tier standard deviation bands and dynamic candlestick coloring.
Indicator
Prop
E7 BBKG indicator with 80% plus accuracy used to show both, possible reversal and trend.
Indicator
Prop
Forex
+9
Average Cost Price helps you keep track of your open positions on the chart. In doing so, it provides lines and explanat
Indicator
VWAP
Volume
+4
Advanced Order Flow & Volume Profiling for cTrader. Unveil institutional footprints, Delta, and Anchored VWAPs.
Indicator
RSI
Forex
+10
Unlock Stochastic RSI PRO in cTrader! Overlay RSI, highlight zones, and identify divergences with customizable settings.
Indicator
EMA
RSI
+5
MACD Colour Histogram with 11 Moving Average Types, Multi-timeframe confirmation and Sound Signal Alert.
Indicator
Signal
Scalping
Average accuracy of around 60% to 70% on 45min timeframes it is highly recommended to use stop losses

Price

Since 10/01/2026
7
Sales