
คำอธิบาย
ตัวบ่งชี้เส้นแนวโน้มคืออะไร?
ตัวบ่งชี้เส้นแนวโน้มเป็นเครื่องมือวิเคราะห์ทางเทคนิคที่ใช้โดยนักเทรดและนักวิเคราะห์เพื่อระบุทิศทางและความแข็งแกร่งของแนวโน้มในตลาดการเงิน โดยอิงจากการวาดเส้นตรงที่เชื่อมจุดราคาสองจุดขึ้นไปบนกราฟ จุดประสงค์หลักของเส้นแนวโน้มคือการแสดงภาพทิศทางทั่วไปของการเคลื่อนไหวของราคาในช่วงเวลาที่กำหนด
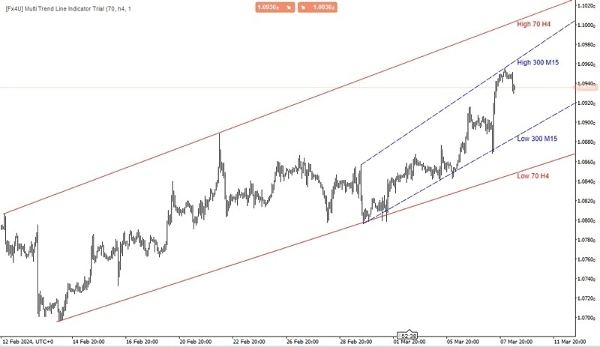
ตัวบ่งชี้เส้นแนวโน้มหลายกรอบเวลา
ฟังก์ชันหลักของตัวบ่งชี้เส้นแนวโน้มหลายกรอบเวลาคือการให้มุมมองที่กว้างขึ้นเกี่ยวกับแนวโน้มตลาดโดยการรวบรวมข้อมูลจากกรอบเวลาต่างๆ โดยการวิเคราะห์แนวโน้มในหลายกรอบเวลา นักเทรดสามารถตัดสินใจได้อย่างมีข้อมูลมากขึ้นเกี่ยวกับจุดเข้าและออกที่เป็นไปได้ รวมถึงทิศทางโดยรวมของตลาด
ตัวบ่งชี้ประเภทนี้มักจะอนุญาตให้นักเทรดปรับแต่งกรอบเวลาที่ต้องการวิเคราะห์และวาดเส้นแนวโน้มตามนั้น มันสามารถเป็นเครื่องมือที่มีคุณค่าสำหรับการระบุระดับแนวรับและแนวต้านที่สำคัญ การกลับตัวของแนวโน้ม และการต่อเนื่องของแนวโน้มในกรอบเวลาต่างๆ ซึ่งช่วยให้นักเทรดตัดสินใจซื้อขายได้แม่นยำยิ่งขึ้น
มีเส้นแนวโน้มหลายประเภท รวมถึง:
- เส้นแนวโน้มขาขึ้น: เส้นนี้วาดโดยเชื่อมจุดต่ำสองจุดขึ้นไปติดต่อกันบนกราฟราคา บ่งชี้ถึงแนวโน้มขาขึ้น หมายความว่าราคามีแนวโน้มเพิ่มขึ้นโดยทั่วไปเมื่อเวลาผ่านไป
- เส้นแนวโน้มขาลง: ในทางตรงกันข้าม เส้นแนวโน้มขาลงวาดโดยเชื่อมจุดสูงสองจุดขึ้นไปติดต่อกันบนกราฟราคา บ่งชี้ถึงแนวโน้มขาลง หมายความว่าราคามีแนวโน้มลดลงโดยทั่วไปเมื่อเวลาผ่านไป
- เส้นแนวโน้มแนวนอน: เรียกอีกชื่อว่าเส้นแนวรับหรือแนวต้าน เส้นเหล่านี้วาดในแนวนอนเพื่อแสดงพื้นที่ที่การเคลื่อนไหวของราคามักจะหยุดชะงักหรือกลับตัว
นักเทรดมักใช้เส้นแนวโน้มร่วมกับตัวบ่งชี้ทางเทคนิคและวิธีการวิเคราะห์อื่นๆ เพื่อช่วยในการตัดสินใจซื้อขายอย่างมีข้อมูล เมื่อเส้นแนวโน้มถูกทำลายหรือทะลุ อาจบ่งชี้ถึงการเปลี่ยนแปลงทิศทางของแนวโน้ม ซึ่งให้สัญญาณการซื้อขายแก่นักลงทุน
ผลิตภัณฑ์อื่นๆ ของฉัน:
https://ctrader.com/products/346
https://ctrader.com/products/336
https://ctrader.com/products/343
https://ctrader.com/products/347
https://ctrader.com/products/148
สรุป
รีวิวจากลูกค้า
5 | 67 % | |
4 | 0 % | |
3 | 33 % | |
2 | 0 % | |
1 | 0 % |
!["[Fx4U] GBPUSD - Price Action" โลโก้](https://cdn.ctrader.com/image/webp/d80b34fc-da3c-4f01-a321-456450665649_26190)

!["[Fx4U] CADJPY - Price Action" โลโก้](https://cdn.ctrader.com/image/webp/1ba81247-b6b7-4f3c-a297-fa3eb1d57fe1_26195)

!["[Fx4U] AUDCHF - Price Action" โลโก้](https://cdn.ctrader.com/image/webp/0a22e9aa-c83b-42cd-b0b8-c1a2da593207_26148)

!["[Fx4U] EURAUD - Price Action" โลโก้](https://cdn.ctrader.com/image/webp/baf8dde4-1ef3-4beb-8ae2-0fed8320f65d_26177)


