present
ลงทะเบียนและรับส่วนลด $50 สำหรับการซื้อครั้งแรกของคุณ
Trading product for Trinity StochX อินดิเคเตอร์ RSI, image 1
Trinity StochX
2.37M
ปริมาณการเทรด
5.23K
Pips ที่ได้กำไร
14
การขาย

คำอธิบาย

สโตแคสติกกับ RSI

ระดับการซื้อ-ขาย

สรุป

สรุปโดย AI
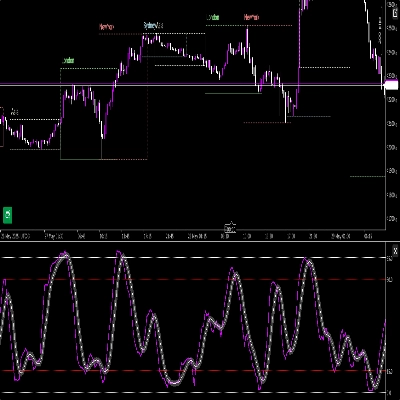
Trinity StochX is a technical indicator combining the Stochastic oscillator with the Relative Strength Index (RSI). It provides buy and sell levels to assist traders in identifying potential entry and exit points. This indicator integrates momentum analysis through RSI with the stochastic method to enhance signal accuracy. It is designed for use within trading platforms that support custom indicators, aiding in market timing decisions based on momentum and overbought/oversold conditions.
โปรไฟล์อินดิเคเตอร์

การสนทนา

รีวิวจากลูกค้า

0.0
รีวิว: 0
รีวิวจากลูกค้า
ยังไม่มีรีวิวสำหรับผลิตภัณฑ์นี้ หากเคยลองแล้ว ขอเชิญมาเป็นคนแรกที่บอกคนอื่น!

คำถามที่พบบ่อย

RSI
ผลิตภัณฑ์ที่มีให้บริการผ่าน cTrader Store รวมถึงบอทการเทรด อินดิเคเตอร์ และปลั๊กอิน มีให้บริการโดยนักพัฒนาบุคคลที่สามและมีไว้เพื่อวัตถุประสงค์ในการเข้าถึงข้อมูลและทางเทคนิคเท่านั้น cTrader Store ไม่ใช่โบรกเกอร์และไม่ได้ให้คำแนะนำการลงทุน คำแนะนำส่วนบุคคล หรือการรับประกันผลการดำเนินงานในอนาคต
เพิ่มเติมจากผู้เขียนคนนี้

"QQEX 2026 ULTRA" โลโก้
4.6
(6)
$19
🚀 QQEX Trinity Indicator - The Ultimate Trading Filter 🚀
"TMAX RBA 2026 ULTRA" โลโก้
4.5
(6)
$20
/
$25
🚀 TMAX RBA Indicator - The Ultimate Multi-Timeframe Momentum System 🚀
🚀 HALF TREND Indicator - The Ultimate Trend Following System 🚀
"MACARX 2026 ULTRA" โลโก้
4.2
(5)
$20
/
$25
🚀 MACARX Indicator - The Multi-Indicator Trend Fusion 🚀
"VQTX 2026 ULTRA" โลโก้
4.4
(5)
$20
/
$25
🚀 VQTX Indicator - The Ultimate Volatility & Trend Analysis Tool 🚀
"STOCHX 2026 ULTRA" โลโก้
4.0
(5)
$20
/
$25
🚀 STOCHX Indicator - Advanced Smoothed Momentum 🚀

นอกจากนี้คุณยังอาจชอบ

"MultiTimeFrameTrend" โลโก้
4.0
(4)
$19
/
$30
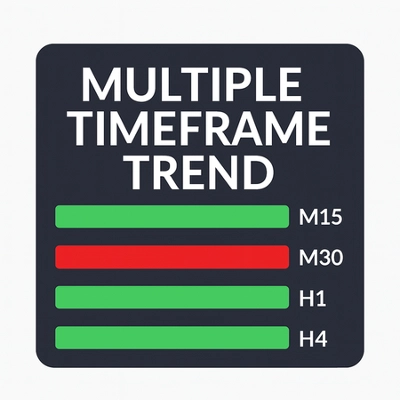
A compact, visual multi-timeframe trend indicator for cTrader. Easily spot bullish or bearish trends across 4 customizab
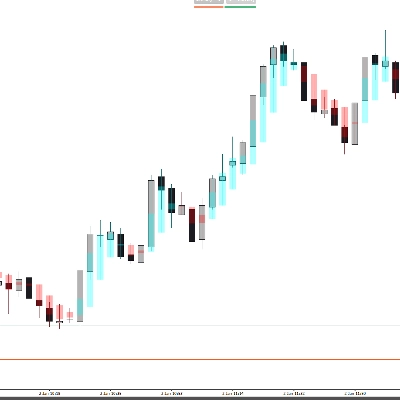
Pro Heikin Ashi Visual Overlay – Clean Trend Visualization
Strong Supertrend Turn Market Movement into a Clear Map Market analysis
"PriceLevels" โลโก้
4.7
(4)
$19
Displays the previous day's, last week's, and last month's highest and lowest price levels on your chart.
"[CB] Pivot Points Pro" โลโก้
4.3
(3)
$19
/
$20
You can use the cTrader Pivot Points Pro indicator to find a good pullback entry in a trend
A professional-grade cTrader indicator for traders following the Inner Circle Trader (ICT) methodology.
Super Trend Rsi ,ATR + trend change distance + dynamic Alpha, divergence/convergence
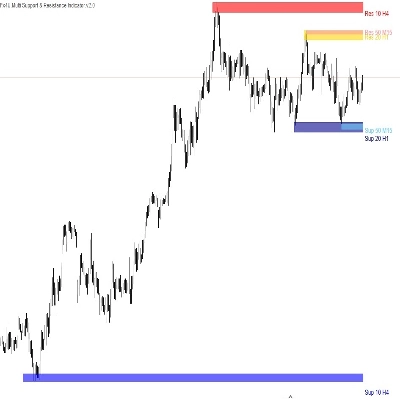
Allow trader to visualize Support & Resistance across different timeframes,give trader an overview of the current market
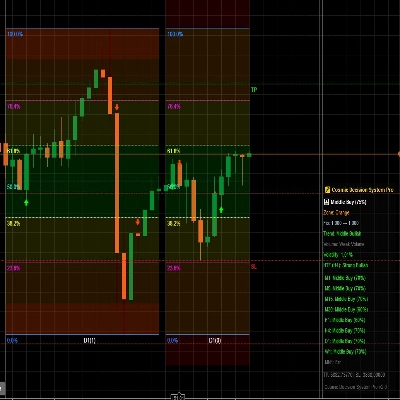
Decision System Indicator According to Cosmic Laws
"Supertrend - Multi-Timeframe" โลโก้
4.2
(4)
$19
/
$25
Supertrend - Multi-Timeframe Indicator
"VWAP_MTF" โลโก้
4.5
(4)
$19
/
$30
📊 VWAP with MTF & Dynamic Deviation Bands
Configure, simulate, and analyze trading strategies with custom filters, multi-target exits, and detailed performance me
"rvwap v1" โลโก้
4.6
(5)
$19
Rolling VWAP with dynamic or fixed time window, customizable source price and standard deviation bands.
Spots key hourly ranges and signals breakouts using arrows & colored background zones. Ideal for Gold.
MultiTF Pivot and SR Indicator
Multi VWAP. Three timeframes. One clean chart. Your Essential Trading Tool.
"FAIR VALUE GAP INDICATOR" โลโก้
4.7
(4)
$19
/
$25
Pinpoint FVGs, track fills and see mitigation stats — trade imbalances with clarity and confidence.
RSI on the main chart with 45/55 momentum levels, overbought/oversold levels, averaged RSI, and multi-timeframe support.

ราคา

2.37M
ปริมาณการเทรด
5.23K
Pips ที่ได้กำไร
14
การขาย