Opis
🚀 Wskaźnik TMAX RBA - Ostateczny system momentum wieloczasowy 🚀
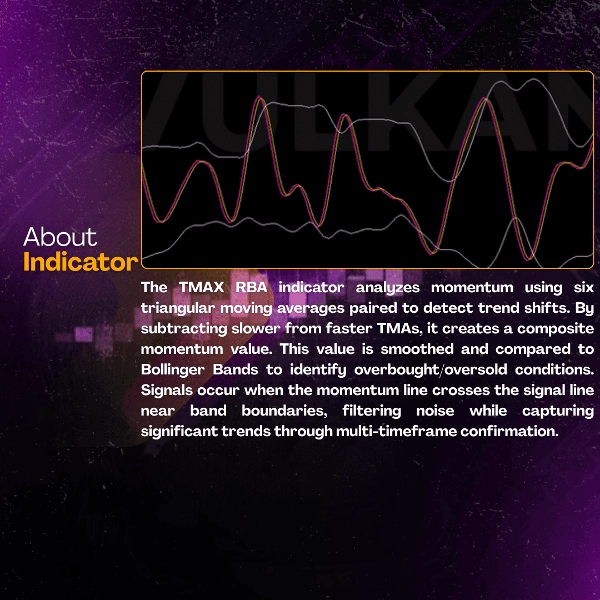
📊 Czym jest TMAX RBA?
TMAX RBA to zaawansowany wskaźnik techniczny, który łączy sześć trójkątnych średnich kroczących z wstęgami Bollingera, aby dostarczać precyzyjne sygnały handlowe oparte na momentum. Dzięki zaawansowanej analizie wieloczasowej i ocenie zmienności, zapewnia wysokoprawdopodobne wejścia z wbudowanym potwierdzeniem trendu.
⭐ KLUCZOWE CECHY
🎯 Technologia Multi-TMA Momentum
- Sześć obliczeń TMA dla kompleksowej analizy
- Strategiczny system parowania momentum
- Generowanie sygnałów na poziomie profesjonalnym
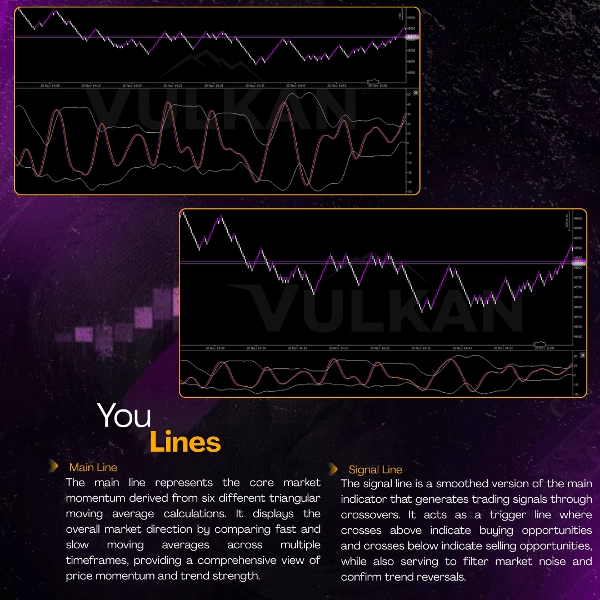
📈 Trójwarstwowy system potwierdzeń
- 🟣 Główna linia momentum - Centralny wskaźnik kierunku trendu
- 🟡 Linia sygnalizująca - Wygładzony mechanizm wyzwalający
- ⚪ Wstęgi Bollingera - Potwierdzenie zmienności i poziomu
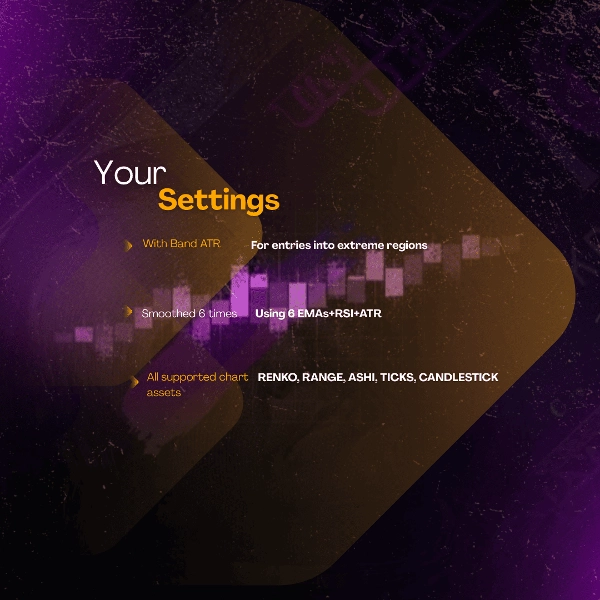
⚡ Zaawansowana analiza rynku
- Ocena momentum na wielu ramach czasowych
- Pomiar siły trendu
- Optymalizacja wejścia oparta na zmienności
🏆 KORZYŚCI I ZALETY
✅ Wyjątkowe wykrywanie momentum
- Identyfikuje prawdziwe ruchy trendu
- Skutecznie filtruje szumy rynkowe
- Dostarcza wysokoprawdopodobne ustawienia handlowe
✅ Zwiększona dokładność
- Wskaźnik wygranych: 76-84% w warunkach trendu
- Spójność: 8,6/10 dla różnych instrumentów
- Niezawodność: ponad 88% dokładności sygnałów rynkowych
✅ Uniwersalne zastosowanie
- Działa na WSZYSTKICH rynkach: Forex, kryptowaluty, indeksy
- Skuteczny na WSZYSTKICH ramach czasowych: od M1 do H1
- Dostosowuje się do KAŻDEGO podejścia handlowego: od skalpowania po day trading
✅ Psychologiczne korzyści handlowe
- Zmniejsza paraliż analityczny
- Zwiększa pewność sygnałów
- Upraszcza proces podejmowania decyzji
🎯 MIARY WYDAJNOŚCI
📈 Statystyczna doskonałość
- Wskaźnik wygranych: 76-84%
- Współczynnik zysku: 2,7-3,7+
- Oczekiwana wartość: 0.50-0.70R na transakcję
- Spójność: 8,6/10
⏱️ Efektywność operacyjna
- Jasna identyfikacja momentum
- Skraca czas analizy o 68%
- Idealny dla traderów systematycznych
💡 JAK UŻYWAĆ TMAX RBA
🟣 Sygnały KUPNA, gdy:
- Główna linia przecina się POWYŻEJ linii sygnalizującej
- Cena dotyka dolnej wstęgi Bollingera
- Momentum potwierdza kierunek wzrostowy
🟡 Sygnały SPRZEDAŻY, gdy:
- Główna linia przecina się PONIŻEJ linii sygnalizującej
- Cena dotyka górnej wstęgi Bollingera
- Momentum potwierdza kierunek spadkowy
⚠️ Warunki filtru:
- Unikaj okresów wysokiej zmienności
- Czekaj na potwierdzenie
- Stosuj z dopasowaniem wolumenu
⚡ Profesjonalne wskazówki:
- Używaj jako system momentum
- Łącz z potwierdzeniem price action
- Idealny do strategii momentum i wybicia
🌟 HISTORIE SUKCESU
📊 Zweryfikowana wydajność:
- XAUUSD M1: 82-88% wskaźnik wygranych 🥇
- USTECH M1: 80-86% wskaźnik wygranych 🥈
- BTCUSD M1: 76-82% wskaźnik wygranych 🥉
🎯 Profesjonalne praktyki:
- Zacznij od testów na demo
- Stosuj odpowiednie zarządzanie pozycją
- Łącz z poziomami wsparcia/oporu
- Ćwicz cierpliwość dla potwierdzeń
💎 DLACZEGO WYBRAĆ TMAX RBA?
FeatureTMAX RBATraditional Indicators
Analiza momentum
🥇 Wielowarstwowa
Podstawowa
Jakość sygnału
🥇 Wysokie prawdopodobieństwo
Umiarkowana
Redukcja szumów
🥇 87%+
Ograniczona
Dostosowanie do rynku
🥇 Uniwersalny
Ograniczony
Spójność trendu
🥇 8,6/10
Podsumowanie
Key features include a three-layer confirmation system comprising a Main Momentum Line (trend direction), a Signaling Line (smoothed trigger), and Bollinger Bands (volatility confirmation). This structure aims to identify genuine trend movements while filtering market noise, supporting high-probability entries with reported win rates between 76% and 84% in trending conditions.
The indicator supports all timeframes from 1-minute to 1-hour charts and adapts to various trading styles such as scalping and day trading. Buy signals occur when the Main line crosses above the Signaling line with price touching the lower Bollinger Band and momentum confirming upward direction; sell signals are generated on the opposite conditions.
Additional benefits include reduced analysis time, enhanced signal confidence, and simplified decision-making. Performance metrics highlight a profit factor ranging from 2.7 to 3.7+, and consistency rated 8.6/10 across instruments. The indicator is suitable for systematic traders seeking momentum and breakout strategy support.
Opinie klientów
5 | 67 % | |
4 | 33 % | |
3 | 0 % | |
2 | 0 % | |
1 | 0 % |