
Deskripsi
Liquidity Cluster Order (LCO) 🔍💧
1. Apa yang ditunjukkan LCO
Liquidity Cluster Order secara otomatis mendeteksi dan menggambar:
- Klaster likuiditas bullish (zona permintaan / akumulasi potensial) ✅
- Klaster likuiditas bearish (zona pasokan / distribusi potensial) 🔻
Setiap klaster adalah:
- berjangkar pada bar pivot volume (maksimum lokal volume),
- diklasifikasikan sebagai bullish atau bearish berdasarkan ekstensi harga terbaru,
- diperpanjang ke depan dalam waktu sampai harga mengurangi (mengonsumsi) klaster tersebut.
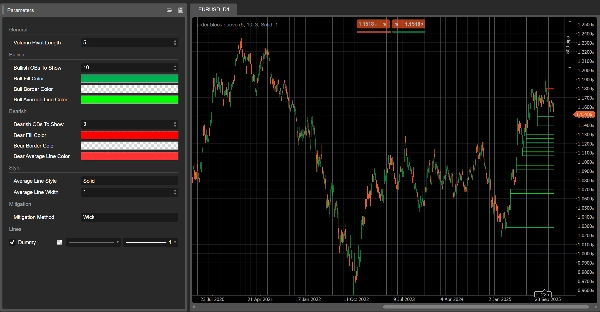
Di grafik Anda melihat:
- Persegi panjang hijau → klaster likuiditas bullish
- Persegi panjang merah → klaster likuiditas bearish
- Sebuah garis abu-abu di dalam setiap persegi panjang → tingkat harga rata-rata dari klaster tersebut
Setelah sebuah klaster dianggap termitigasi, klaster tersebut menghilang dari grafik dan hanya klaster aktif yang tersisa.
2. Logika deteksi (dalam istilah sederhana)
- Pivot volume
-
- LCO memindai bar di mana volume lebih tinggi daripada bar
Volume Pivot Lengthsebelumnya dan berikutnya. - Bar-bar ini adalah pivot volume – jangkar potensial untuk klaster likuiditas.
- LCO memindai bar di mana volume lebih tinggi daripada bar
- Konteks: bullish vs bearish
-
- Perilaku harga terbaru menentukan sebuah konteks:
-
- Konteks bullish → ekstensi ke bawah yang mendominasi.
- Konteks bearish → ekstensi ke atas yang mendominasi.
- Konteks ini menentukan apakah pivot volume berikutnya akan membuat klaster likuiditas bullish atau bearish.
- Klaster likuiditas bullish
Dalam konteks bullish: -
- Dasar klaster = rendah dari bar pivot
- Atas klaster = titik tengah bar (
(tinggi + rendah) / 2) - Interpretasi: zona di mana tekanan ke bawah diserap dan pembeli masuk dengan agresif.
- Klaster likuiditas bearish
Dalam konteks bearish: -
- Dasar klaster = titik tengah bar pivot
- Atas klaster = tinggi dari bar pivot
- Interpretasi: zona di mana tekanan ke atas diserap dan penjual mengambil kendali.
- Garis rata-rata
-
- Untuk setiap klaster, LCO menghitung rata-rata atas & bawah dan menggambar sebuah garis tengah abu-abu.
- Ini berfungsi sebagai tingkat keseimbangan internal dari klaster.
- Mitigasi (konsumsi klaster)
Pada setiap bar baru, LCO memeriksa apakah sebuah klaster termitigasi: -
- Untuk klaster bullish:
-
- Ia melacak harga target ke bawah target price selama
Volume Pivot Lengthbar terakhir: -
Metode Mitigasi = Wick→ rendah terendah.Metode Mitigasi = Close→ penutupan terendah.
- Jika harga target ini turun di bawah dasar klaster, klaster bullish dianggap termitigasi dan dihapus.
- Ia melacak harga target ke bawah target price selama
- Untuk klaster bearish:
-
- Ia melacak harga target ke atas target price:
-
Wick→ tinggi tertinggi.Close→ penutupan tertinggi.
- Jika harga target ini naik di atas puncak klaster, klaster bearish dianggap termitigasi dan dihapus.
Termitigasi = likuiditas dalam klaster tersebut diasumsikan terkonsumsi / tidak berlaku.
3. Cara membaca LCO di grafik
Anda akan melihat terutama:
- Klaster hijau di bawah harga → potensi zona likuiditas permintaan
- Klaster merah di atas harga → potensi zona likuiditas pasokan
Pembacaan tipikal (bukan saran perdagangan):
- Klaster baru
-
- Klaster yang baru dibuat seringkali lebih relevan:
-
- Klaster bullish di bawah harga → area di mana pembeli terakhir menyerap tekanan jual.
- Klaster bearish di atas harga → area di mana penjual terakhir menyerap tekanan beli.
- Retest klaster
-
- Harga kembali ke klaster bullish dari atas:
-
- Jika harga bereaksi dan bertahan di dasar → kemungkinan pantulan / zona reaksi long.
- Harga kembali ke klaster bearish dari bawah:
-
- Jika harga gagal untuk berdagang di atas puncak → kemungkinan penolakan / zona reaksi short.
- Klaster termitigasi vs aktif
-
- Ketika harga menembus sebuah klaster melewati batasnya sesuai metode mitigasi yang dipilih,
→ klaster likuiditas tersebut dihapus pada bar berikutnya. - Klaster yang masih terlihat adalah zona likuiditas aktif yang belum sepenuhnya dilalui perdagangan.
- Ketika harga menembus sebuah klaster melewati batasnya sesuai metode mitigasi yang dipilih,
- Menggunakan garis tengah
-
- Garis tengah abu-abu itu dapat digunakan sebagai:
-
- tingkat pengambilan keuntungan atau keluar parsial di dalam klaster,
- referensi “harga wajar” dalam zona likuiditas,
- cara cepat untuk melihat apakah harga berdagang di setengah atas atau bawah klaster.
4. Parameter (Bahasa Inggris)
Volume Pivot Length
- Bar yang digunakan untuk:
-
- mendeteksi pivot volume,
- menghitung ekstrem dan target mitigasi.
- Nilai lebih rendah → lebih banyak klaster, lebih banyak noise;
- Nilai lebih tinggi → lebih sedikit, klaster lebih signifikan.
Klaster Likuiditas Bullish Untuk Ditampilkan
(sebelumnya Bullish OBs To Show)
- Jumlah maksimum klaster bullish yang ditampilkan di grafik.
Klaster Likuiditas Bearish Untuk Ditampilkan
(sebelumnya Bearish OBs To Show)
- Jumlah maksimum klaster bearish yang ditampilkan.
Warna Isi Bull / Warna Isi Bear
- Warna isi klaster bullish/bearish.
- Anda dapat menyertakan nilai alfa (opacity).
Warna Garis Rata-rata Bull/Bear
- Warna garis tengah internal untuk setiap klaster.
Gaya Garis Rata-rata
- Gaya visual untuk garis tengah:
"Solid","Dashed","Dotted".
Lebar Garis Rata-rata
- Ketebalan garis tengah.
Metode Mitigasi
"Wick"→ mitigasi berdasarkan ekor tinggi/rendah (lebih sensitif)."Close"→ mitigasi berdasarkan harga penutupan (lebih konservatif).
Ringkasan
On the chart, bullish clusters appear as green rectangles below the price, indicating areas where buyers absorbed selling pressure. Bearish clusters are shown as red rectangles above the price, marking zones where sellers absorbed buying pressure. Each cluster includes a grey mid-line representing the average price level, serving as an internal equilibrium reference.
Clusters extend forward in time until price "mitigates" or consumes them, at which point they disappear, leaving only active liquidity zones visible. Mitigation is determined by tracking price extremes (high/low wicks or closing prices) over a configurable number of bars.
Key parameters include the volume pivot length (defining sensitivity and cluster significance), maximum clusters displayed, cluster colors, mid-line style, and mitigation method. LCO supports various markets including forex, indices, commodities, stocks, and cryptocurrencies, and integrates with multiple trading strategies and indicators such as RSI, MACD, Bollinger Bands, and Fibonacci levels.
Ulasan pelanggan
5 | 100 % | |
4 | 0 % | |
3 | 0 % | |
2 | 0 % | |
1 | 0 % |


