
Beschreibung
═══════════════════════════════════════════════════════════════
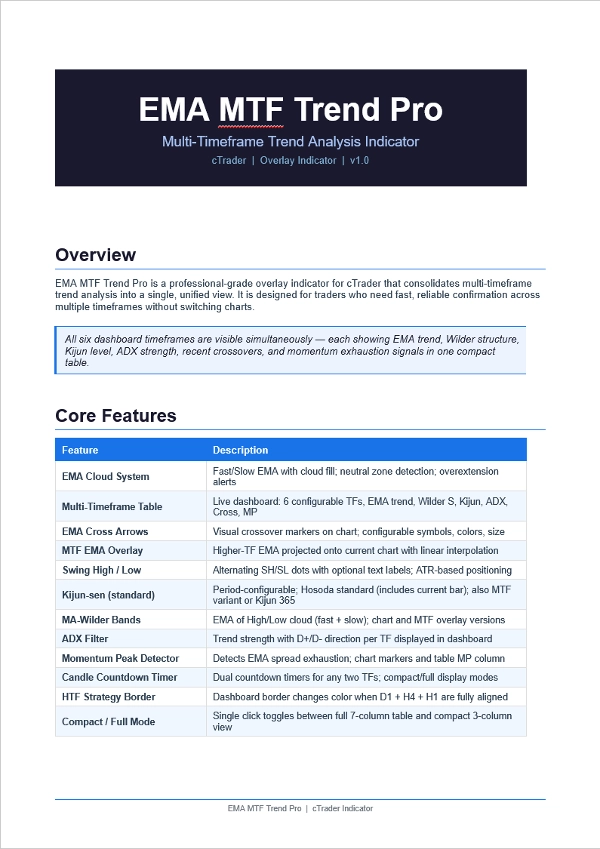
EMA MTF TREND PRO — Multi-Timeframe Trendanalyse-Indikator
cTrader Overlay-Indikator
═══════════════════════════════════════════════════════════════
Sehen Sie das vollständige Trendbild über 6 Zeitrahmen hinweg — in einer Tabelle,
auf einem Chart, ohne Fenster wechseln zu müssen.
───────────────────────────────────────────────────────────────
WAS ES TUT
───────────────────────────────────────────────────────────────
EMA MTF Trend Pro kombiniert EMA-Trendrichtung, Wilder-Kanalstruktur,
Kijun-sen-Niveaus, ADX-Stärke, Kreuzungssignale
und Momentum-Erschöpfung in einem einzigen Live-Dashboard.
Jede Zeile in der Tabelle ist ein anderer Zeitrahmen. Jede Spalte
beantwortet eine andere Frage zu diesem Zeitrahmen. Ein Blick
zeigt Ihnen, ob die Zeitrahmen übereinstimmen — und ob es sicher ist,
einzusteigen.
───────────────────────────────────────────────────────────────
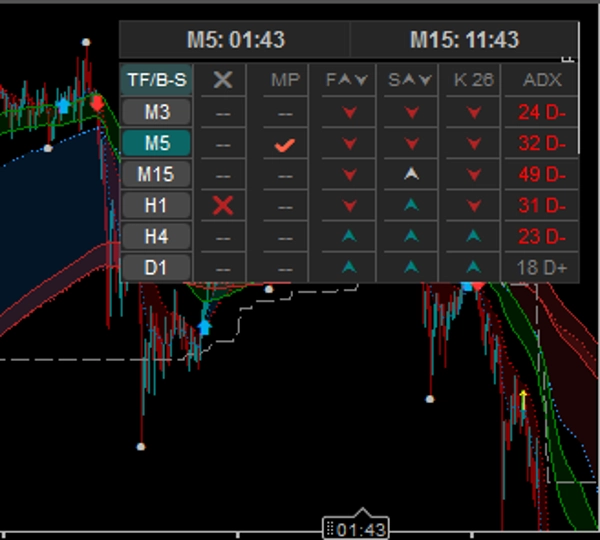
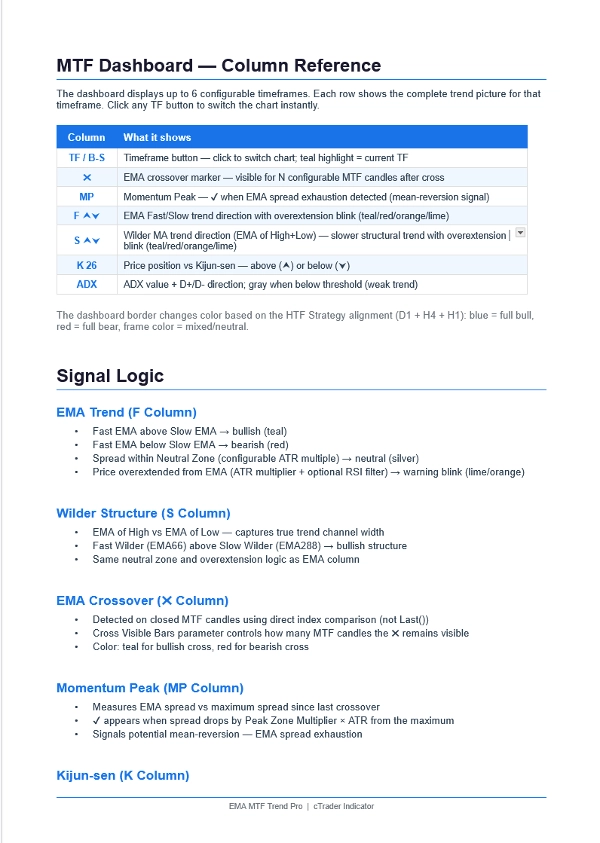
DASHBOARD — 6 ZEITRAHMEN × 7 SPALTEN
───────────────────────────────────────────────────────────────
Spalte Was sie zeigt
──────── ──────────────────────────────────────────────────
TF/B-S Zeitrahmen-Schaltfläche — klicken, um Chart sofort zu wechseln
Türkis markiert = aktuell angezeigter Zeitrahmen
✖ EMA-Kreuzung — sichtbar für N konfigurierbare Kerzen
Türkis = bullisches Kreuz | Rot = bärisches Kreuz
MP Momentum-Peak — ✔ wenn EMA-Spanne erschöpft ist
Warnsignal für Mittelwertumkehr
F ⮝⮟ EMA Schnell- vs. Langsam-Trendrichtung
Türkis = aufwärts | Rot = abwärts | Silber = neutral
Blinkt, wenn der Preis vom EMA überdehnt ist
S ⮝⮟ Wilder MA-Struktur (EMA von Hoch/Tief)
Langsamerer, strukturellerer Trendfilter
K 26 Preis vs. Kijun-sen
⮝ = Preis darüber (Unterstützung) | ⮟ = darunter (Widerstand)
ADX Trendstärke + D+/D- Richtung
Grau = schwacher/seitwärts gerichteter Markt (unter Schwelle)
───────────────────────────────────────────────────────────────
FUNKTIONEN
───────────────────────────────────────────────────────────────
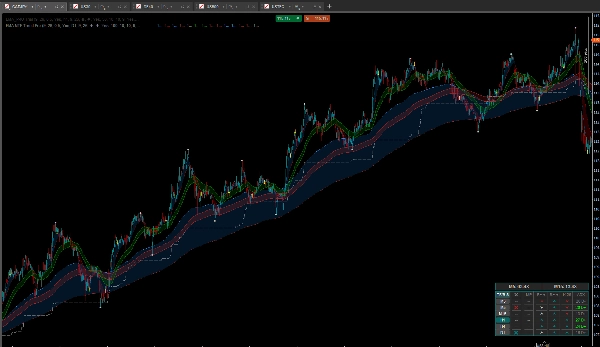
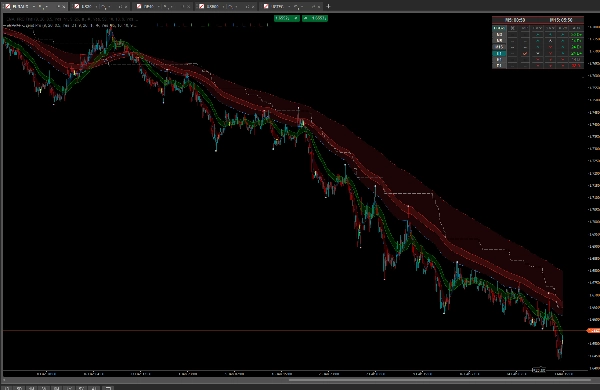
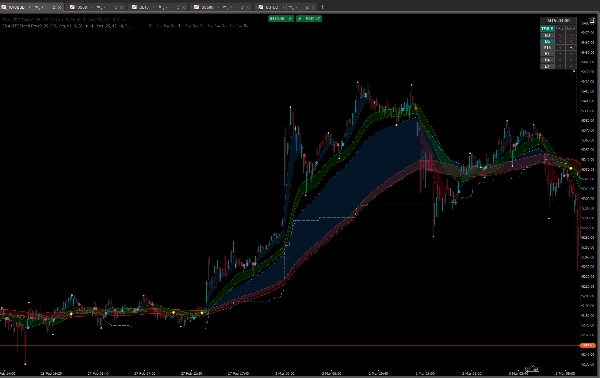
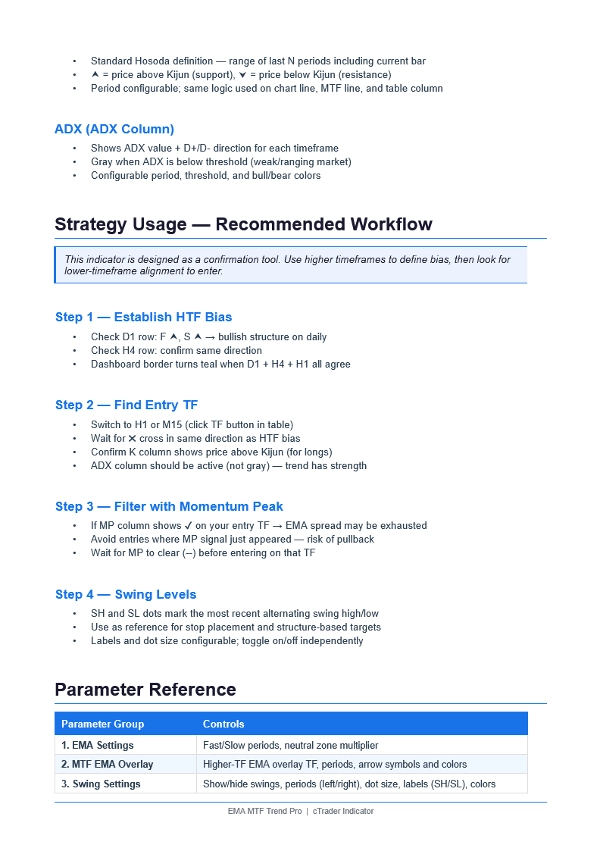
EMA-WOLKENSYSTEM
• Schneller + langsamer EMA mit farbiger Wolkenfüllung
• Neutralzonen-Erkennung (konfigurierbarer ATR-Multiplikator)
• Überdehnungswarnungen mit RSI-Filter
MTF EMA OVERLAY
• Projiziert jeden höheren TF EMA auf den aktuellen Chart
• Lineare Interpolation — glatte Linien, keine Stufen
• Kreuzungspfeile mit konfigurierbaren Symbolen und Farben
• Blendet Overlay-Pfeile automatisch aus, wenn ein höherer TF
im Dashboard ausgewählt ist (verhindert visuelles Durcheinander)
SWING-HOCHS & -TIEFS
• Wechselnde SH / SL Punkte — keine doppelten aufeinanderfolgenden Hochs
• Optionale SH / SL Textbeschriftungen mit ATR-basierter Positionierung
• Konfigurierbare Punktgröße, Beschriftungsgröße, Farben
• Ein- / Ausschalter für die gesamte Swing-Anzeige
KIJUN-SEN
• Standard Hosoda-Definition (entspricht TradingView / MT4)
• Konfigurierbare Periode
• Auch als MTF Overlay-Linie im Chart verfügbar
MA-WILDER BÄNDER
• EMA von Hoch und EMA von Tief — erzeugt einen Trendkanal
• Schnelles Band (EMA66) + langsames Band (EMA288)
• Verfügbar im Chart und als MTF Overlay
HTF STRATEGIEGRENZE
• Dashboard-Rand wird türkis, wenn D1 + H4 + H1
alle bullisch sind (EMA + Wilder ausgerichtet)
• Wird rot, wenn alle drei bärisch sind
• Sofortige visuelle Bestätigung der vollständigen Multi-TF-Ausrichtung
KERZEN-RÜCKZÄHL-TIMER
• Doppelte Timer — beliebige zwei Zeitrahmen
• Zweiter Timer kann dem aktuellen Chart-TF folgen
• Kompaktes Layout im Einspaltenmodus
KOMPAKT- / VOLLMODUS
• Klicken Sie auf die TF/B-S-Überschrift zum Umschalten
• Vollmodus: 7 Spalten (alle Signale)
• Kompaktmodus: 3 Spalten (TF, EMA, Wilder) — minimaler Platzbedarf
───────────────────────────────────────────────────────────────
STRATEGIE — ANWENDUNG
───────────────────────────────────────────────────────────────
SCHRITT 1 — BIAS FESTLEGEN (Höhere Zeitrahmen)
• D1-Zeile: F ⮝ + S ⮝ = bullische Tagesstruktur
• H4-Zeile: gleiche Richtung = Trend bestätigt
• Dashboard-Rand wird türkis = D1 + H4 + H1 stimmen alle überein
SCHRITT 2 — EINSTIEG FINDEN (Niedriger Zeitrahmen)
• Klicken Sie in der Tabelle auf H1 oder M15, um den Chart zu wechseln
• Warten Sie auf ✖ Kreuz in der gleichen Richtung wie der HTF-Bias
• K-Spalte zeigt ⮝ (Preis über Kijun) für Longs
• ADX-Spalte ist aktiv, nicht grau (Trend hat Stärke)
SCHRITT 3 — FILTER MIT MOMENTUM-PEAK
• MP-Spalte zeigt ✔ → EMA-Spanne erschöpft → Einstieg vermeiden
• Warten Sie, bis MP frei ist (--) bevor Sie einsteigen
• Auf niedrigeren TFs verwenden, um Einstiege an EMA-Extremen zu vermeiden
SCHRITT 4 — SWING-LEVELS NUTZEN
• SH-Punkt = jüngstes Swing-Hoch (Widerstand / Stop-Referenz)
• SL-Punkt = jüngstes Swing-Tief (Unterstützung / Ziel-Referenz)
• Punkte wechseln sich ab — immer ein Hoch, ein Tief zur Zeit
───────────────────────────────────────────────────────────────
PARAMETERGRUPPEN
───────────────────────────────────────────────────────────────
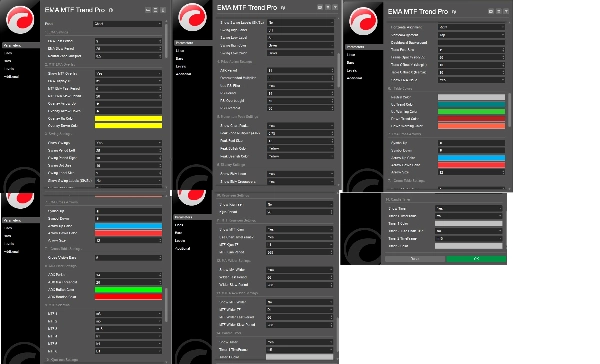
1. EMA-Einstellungen — schnelle/langsame Perioden, Neutralzone
2. MTF EMA Overlay — TF, Perioden, Pfeilstil
3. Swing-Einstellungen — Anzeigen/Verbergen, Perioden, Beschriftungen, Farben
4. Preisaktion — ATR, Überdehnung, RSI-Filter
5. Momentum-Peak — Zonenmultiplikator, Schriftart, Farben
6. Anzeigeeinstellungen — Linien, Wolke, Tabellenlayout
6.1 Tabellenfarben — Vollständige Farbpalette-Steuerung
7. EMA-Kreuzpfeile — Symbole, Farben, Größe
7.1 Kreuztabelleneinstellungen — Kreuz sichtbare Balken (N Kerzen)
8. ADX-Filter — Periode, Schwelle, Farben
9. MTF-Auswahl — 6 × unabhängige TF-Auswähler
10. Kijun-sen — Anzeigen/Verbergen, Periode
11. MTF Kijun-sen — TF, Periode, Chart-TF-Option
12. MA-Wilder — Anzeigen/Verbergen, schnelle/langsame Perioden
13. MTF MA-Wilder — TF, schnelle/langsame Perioden
14. Kerzen-Timer — TFs, Farben, Chart-TF-Option
───────────────────────────────────────────────────────────────
Zusammenfassung
Kundenbewertungen
5 | 0 % | |
4 | 100 % | |
3 | 0 % | |
2 | 0 % | |
1 | 0 % |


![„[Stellar Strategies] Smart ADX“-Logo](https://cdn.ctrader.com/image/webp/af13b084-b6f6-41db-b7bc-c7e688b57b05_36929)


