present
Registrieren Sie sich und erhalten Sie $50 Rabatt auf Ihren ersten Kauf
Trading product for HCCC MTF cbot indicator Indikator BTCUSD Forex, image 1
HCCC MTF cbot indicator
Indikator
138 downloads
Version 1.0, Apr 2026
Windows, Mac
Trading product for HCCC MTF cbot indicator Indikator BTCUSD Forex, image 2
Trading product for HCCC MTF cbot indicator Indikator BTCUSD Forex, image 3
Trading product for HCCC MTF cbot indicator Indikator BTCUSD Forex, image 4
Trading product for HCCC MTF cbot indicator Indikator BTCUSD Forex, image 5
Trading product for HCCC MTF cbot indicator Indikator BTCUSD Forex, image 6
Trading product for HCCC MTF cbot indicator Indikator BTCUSD Forex, image 7
33
Verkäufe
1.01K
Kostenlose Installationen

Beschreibung

HCCC MTF - Hurst Cycle Composite Channel (100% KOSTENLOS)

Überblick
Der HCCC MTF (Hurst Cycle Composite Channel) ist ein fortschrittliches, vollständig interaktives Multi-Timeframe (MTF) Dashboard und Kanalindikator. Basierend auf den zyklischen Theorien von J.M. Hurst kombiniert mit ATR-Volatilität hilft dieses Tool Ihnen, den wahren Markttrend und die perfekten zyklischen Wendepunkte (Hochs und Tiefs) über mehrere Zeitrahmen gleichzeitig zu identifizieren.


Das zweite ist dem halbautomatischen Handel mit https://ctrader.com/products/3618?u=cLogic


WICHTIG: Dieser Indikator ist komplett 100% KOSTENLOS für alle. Er wurde speziell als ultimativer visueller Begleiter für den "Follow The Trend XAU Edition" cBot entwickelt.
Während Sie ihn perfekt für den manuellen Handel verwenden können, entfaltet sich seine wahre Stärke in einer halbautomatischen Einrichtung: Sie nutzen das HCCC Dashboard, um den Zyklus und das Momentum der höheren Zeitrahmen zu lesen, und aktivieren dann den Follow The Trend XAU Edition cBot, um die Trades in dieser Richtung präzise auszuführen und zu verwalten.

Hauptmerkmale

1. Interaktives MTF Dashboard (anklickbar)
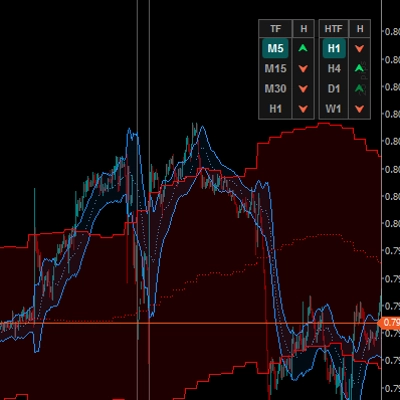
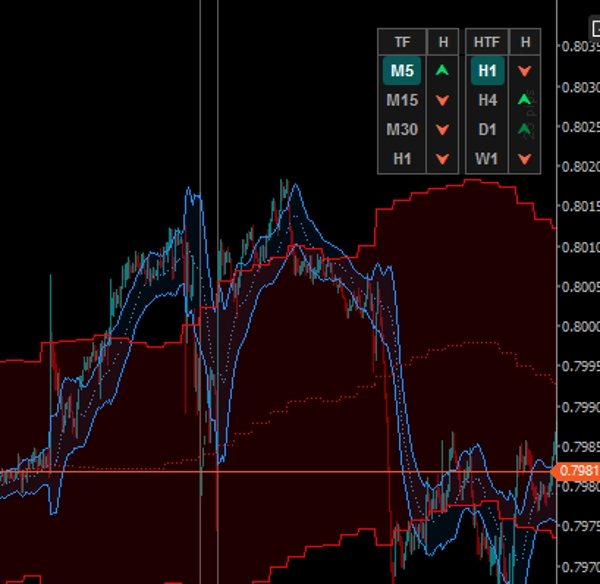
Vergessen Sie das ständige Wechseln zwischen Charts. Das Dashboard auf dem Chart verfolgt 4 niedrigere Zeitrahmen (LTF) und 4 höhere Zeitrahmen (HTF).

  • LTF-Schaltflächen: Klicken Sie auf eine beliebige LTF-Schaltfläche, um sofort den Zeitrahmen Ihres aktuellen Charts zu ändern.
  • HTF-Schaltflächen: Klicken Sie auf eine beliebige HTF-Schaltfläche, um den Kanal dieses spezifischen höheren Zeitrahmens direkt auf Ihrem aktuellen Chart zu projizieren!

2. Duales Kanal-Overlay-System
Der Indikator zeichnet gleichzeitig zwei elegante, wolkengefüllte Kanäle in Ihrem Chart:

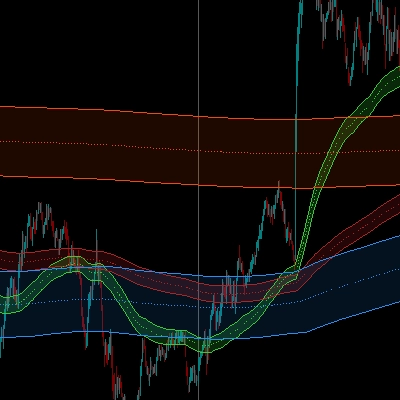
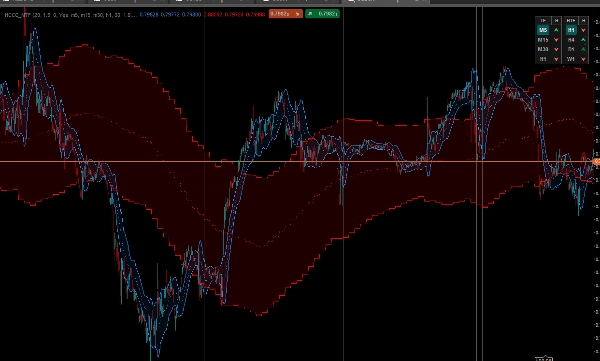
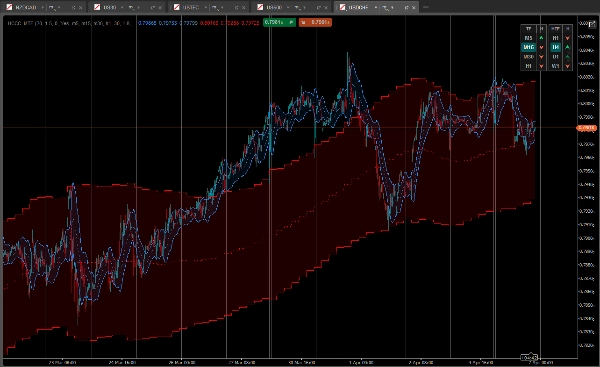
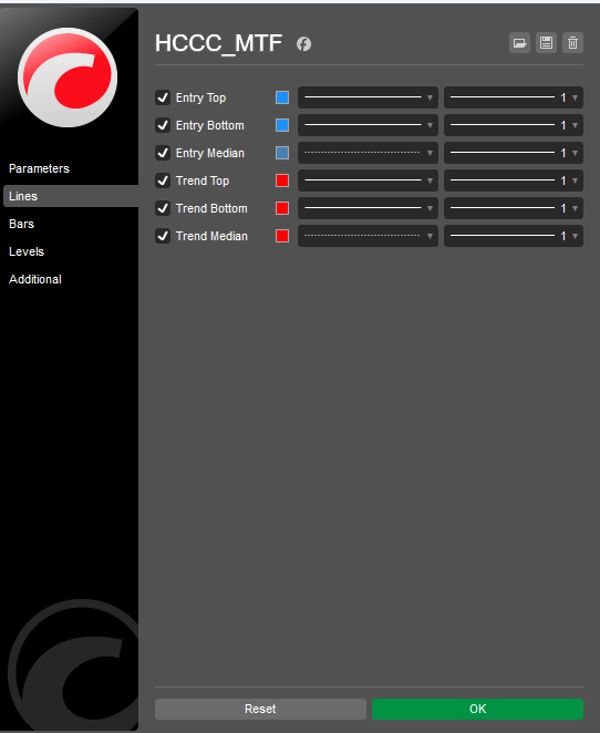
  • Einstiegszyklus (blaue Wolke): Berechnet den Hurst-Zyklus basierend auf dem Zeitrahmen Ihres aktuellen Charts.
  • Trendzyklus (rote Wolke): Ein Makro-Ansichtskanal, berechnet aus dem höheren Zeitrahmen, den Sie im Dashboard ausgewählt haben.

3. Fortschrittliche 5-Zustands-Zyklus-Signale
Das Dashboard zeigt nicht nur die Trendrichtung; es zeigt die Phase des Zyklus, indem es die Steigung der Medianlinie und die Position des Preises relativ zu den ATR-Bändern analysiert.

  • [ ⮝ ] Dunkelgrün (starker Kauf): Die Mediansteigung ist STEIGEND, und der Preis ist auf das untere Band gefallen. Dies ist ein zyklisches Tief (Kaufe den Rücksetzer).
  • [ ⮝ ] Hellgrün (schwacher Kauf): Der Trend ist STEIGEND, aber der Preis bewegt sich um das Median- oder obere Band.
  • [ — ] Grau (neutral): Der Zyklus ist flach. Kein klarer Impuls.
  • [ ⮟ ] Hellrot (schwacher Verkauf): Der Trend ist FALLEND, aber der Preis ist nahe dem Median.
  • [ ⮟ ] Dunkelrot (starker Verkauf): Die Mediansteigung ist FALLEND, und der Preis ist zum oberen Band gestiegen. Dies ist ein zyklisches Hoch (Verkaufe die Rallye).

Wie verwendet man es mit dem "Follow The Trend XAU Edition" cBot?

  1. Schauen Sie auf die rechte Seite des Dashboards (HTF-Spalte). Warten Sie auf eine klare Ausrichtung der höheren Zeitrahmen (z.B. H4 und D1 zeigen dunkel-/hellgrüne Pfeile).
  2. Schauen Sie auf die linke Seite des Dashboards (LTF-Spalte), um einen lokalen Rücksetzer zu finden (z.B. M15 zeigt einen dunkelgrünen "starken Kauf"-Pfeil).
  3. Sobald die MTF-Logik übereinstimmt, aktivieren Sie Ihren Follow The Trend XAU Edition cBot in Richtung "KAUF" und lassen Sie seine Algorithmen den Einstieg, Trailing Stops und das Risikomanagement übernehmen.

Anpassung
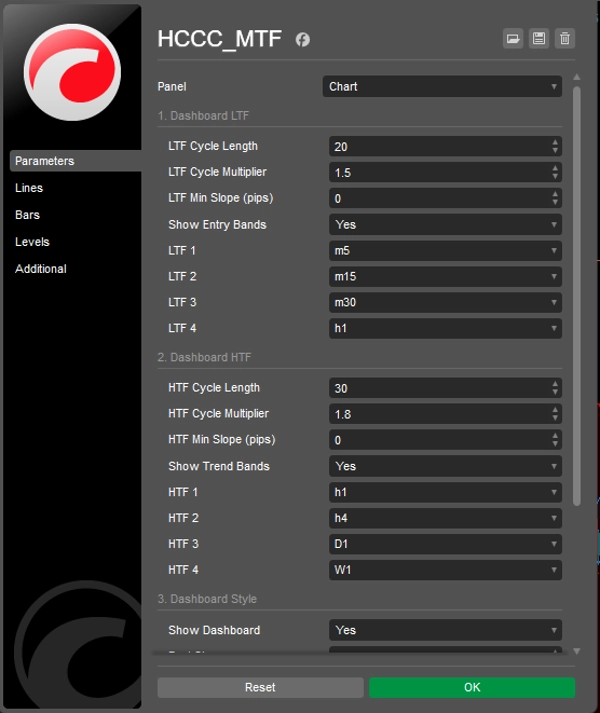
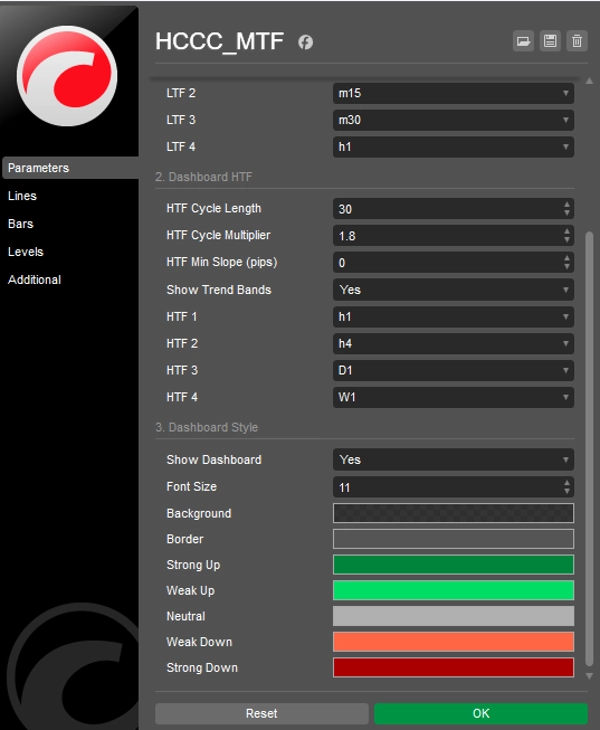
Alles ist vollständig anpassbar: Zykluslängen, ATR-Multiplikatoren, minimale Steigungsempfindlichkeit (in Pips) zur Filterung von Rauschen sowie volle Kontrolle über die UI-Farben und Positionierung.

Laden Sie es jetzt KOSTENLOS herunter und bringen Sie Ihren halbautomatischen Handel auf die nächste Stufe!

Zusammenfassung

KI-Zusammenfassung
The HCCC MTF (Hurst Cycle Composite Channel) indicator is a multi-timeframe (MTF) tool designed for semi-automated trading. It integrates J.M. Hurst's cyclic theories with ATR-based volatility to identify market trends and cyclic turning points (peaks and troughs) across multiple timeframes simultaneously. The indicator features an interactive on-chart dashboard that tracks four lower and four higher timeframes, allowing users to switch chart timeframes or project higher timeframe channels onto the current chart with a click.

It overlays two cloud-filled channels: a blue "Entry Cycle" channel based on the current timeframe and a red "Trend Cycle" channel derived from a selected higher timeframe. The dashboard provides advanced five-state cyclic signals indicating strong or weak buy/sell conditions and neutral phases by analyzing the slope of the median line and price position relative to ATR bands.

The indicator is fully customizable, including cycle lengths, ATR multipliers, slope sensitivity, and UI appearance. It is intended to complement the "Follow The Trend XAU Edition" cBot by providing visual cycle and momentum analysis to guide semi-automated trade execution and management. The HCCC MTF supports various markets including Forex, commodities, indices, stocks, and cryptocurrencies.
Indikatorprofil
Indikatorkategorie
Trend
Ausgabetyp
Visualisierung
Signale
Filter
Datenanforderungen
Nur Balken
Unterstützte Signale
Ausbruch

Diskussion

Kundenbewertungen

0.0
Bewertungen: 0
Kundenbewertungen
Bisher gibt es keine Bewertungen für dieses Produkt. Haben Sie es schon ausprobiert? Dann können Sie die erste Person sein, die andere darüber informiert!

Häufig gestellte Fragen (FAQ)

BTCUSD
Forex
Signal
Indices
EURUSD
Commodities
GBPUSD
NZDUSD
Prop
Crypto
Stocks
XAUUSD
NAS100
ATR
USDJPY
Über den cTrader Store verfügbare Produkte, einschließlich Handelsbots, Indikatoren und Plugins, werden von externen Entwicklern bereitgestellt und nur zu Informations- und technischen Zugriffszwecken verfügbar gemacht. cTrader Store ist kein Broker und erbringt keine Anlageberatung, persönlichen Empfehlungen oder eine Garantie für zukünftige Performance.

Mehr von diesem Autor

Indikator
AI
Prop
+8
The EMA Trend Simple is a trend-following tool designed for simplicity and visual clarity.
cBot
Prop Firm Fit
Stop Loss (SL) Manager
+1
HTS Strategy Tester - Advanced Multi-Timeframe Trend & Pullback Trading System H1/m1 & H4/m5 WWS 33/144 Start from 100$
90.1%
Rendite
2.92
Gewinnfaktor
Indikator
AI
Grid
+7
Follow The Trend cBot - INDICATOR - displays two Moving Average Bands for cBot or for your own use
Indikator
AI
SMC
+7
The ultimate tool for Price Action and ICT. High, Low and Mid levels for days, weeks Inc. NY Midnight and Custom Range.
Indikator
Key Levels
TP_SL Very useful Risk & Reward Tool. Bring the ultimate TradingView-style Long/Short Position
Indikator
ATR
MACD
+15
MACD Advanced -- It combines the standard MACD logic with a rich set of visual tools
Indikator
AI
RSI
+7
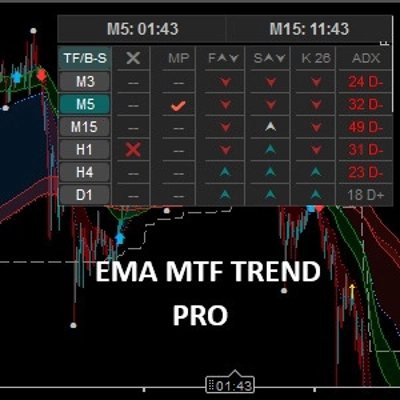
EMA MTF TREND PRO - Multi-timeframe trend analysis overlay indicator, 6 timeframes - in one table with ADX
Indikator
AI
Prop
+7
EMA Clouds, Multi-Timeframe (MTF) Overlay, Swing High/Low detection, and a smart Dashboard with neutral zone filtering.
Indikator
AI
SMC
+4
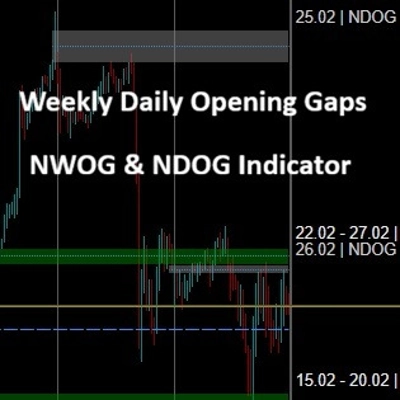
Weekly Daily Opening Gaps — NWOG & NDOG Indicator Professional-grade opening gap visualization for institutional traders
Indikator
ATR
Channel
+1
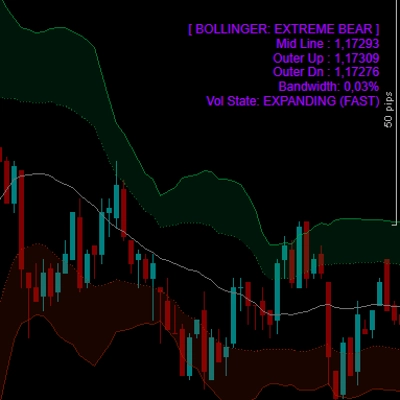
Bollinger Bands Advanced Squeeze & Breakout System, Real-Time On-Chart Dashboard, Auto-Squeeze Detector, Dual-Band Cloud
„RSI Advanced“-Logo
Beste Ratings
5.0
(4)
$20
/
$30
Indikator
AI
ATR
+12
The standard Relative Strength Index (RSI), RSI & Signal Cloud, Smart Volatility Filter (ATR), On-Chart Info Dashboard
Indikator
SMC
Prop
+11
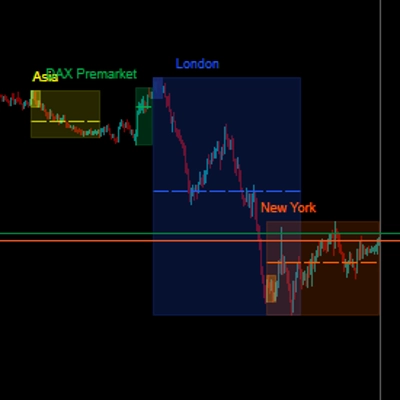
Sessions PRO is a professional session visualization indicator - 4 Fully Customizable Sessions

Das könnte Sie auch noch interessieren

Indikator
VWAP
Volume
+3
Don't trust static support and resistance levels, this indicator combines Fibonacci and VWAP in one powerful tool.
Indikator
Imbalance
Key Levels
+5
Smart Money Concepts (SMC) indicator with real-time Fair Value Gap (FVG) boxes, $50 round numbers, and live market HUD.
Indikator
AI
Forex
+5
Whale Hunting Indicator
Indikator
VWAP
Support & Resistance
Trading.FC$_vwap Algo shows VWAP trends, dynamic support/resistance and deviation bands to spot potential trade entries.
Indikator
Signal
Stocks
+5
🚀 Automated Elliott Wave & Fibonacci tool for cTrader. Spot trends, corrections & retracements fast.
Indikator
AI
SMC
+11
Sync vertical lines automatically between multiple charts of the same symbol. Mark once — see it everywhere. Ideal for m
Indikator
ADX
ATR
+3
Get complete access to HAI Quantum V7 trial
Indikator
Forex
Multi-timeframe candlesticks!
Indikator
ATR
Volume
+1
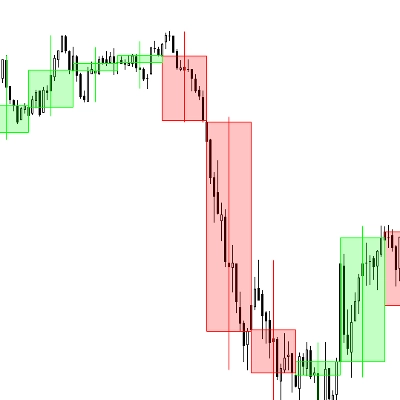
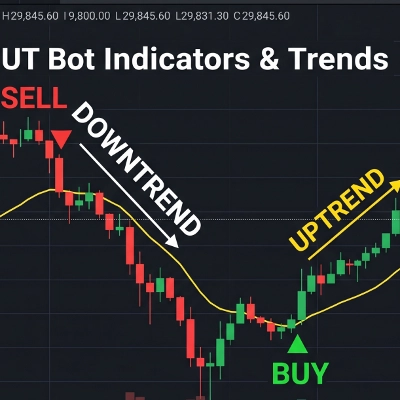
The UT Bot identify potential trend reversals and momentum shifts.
Indikator
Fibonacci
Key Levels
+1
Explore Elliott wave counts, three swing sizes and example levels with an interactive cTrader chart panel.
Indikator
SMC
Prop
+9
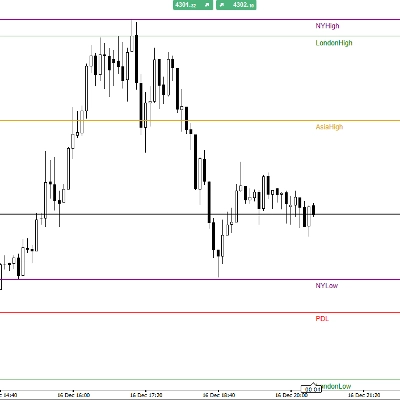
PDL/PDH/PWL/PWH and Session higs/lows (customizable)
Indikator
ADX
ATR
+2
GOLD SENTINEL v1.0 - A CANDLE-COLORING INDICATOR FOR GOLD.
Indikator
ADX
ATR
+5
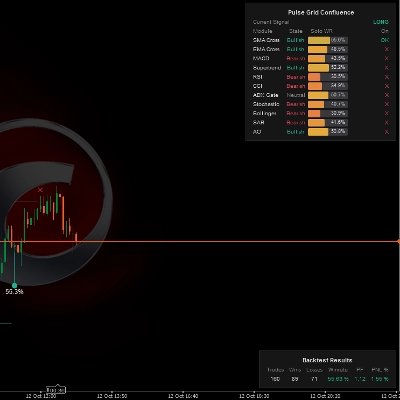
Multi-indicator confluence HUD & real-time backtest engine to detect trend alignment and filter high-probability setups.
Indikator
RSI
Forex
+12
Indicator pattern signal moment
Indikator
SMC
Forex
+5
Pinpoint FVGs, track fills and see mitigation stats — trade imbalances with clarity and confidence.
Indikator
Visually master the Inside Bar strategy with clear breakout signals and professional chart highlighting 📈🔔📉
Indikator
MACD
Prop
+8
NTNPICLL is a tool to check the best trading hours for the assets and also includes the highest and lowest point
Indikator
Volume
Imbalance
+1
Volume profile indicator that auto-detects the latest trendline. Shows POC, Value Area (VAH/VAL), and High Volume Nodes

Preis

33
Verkäufe
1.01K
Kostenlose Installationen