Liquidity Profiler Tools
Indicator
Version 1.0, Jun 2026
Windows, Mac
Trading product for Liquidity Profiler Tools Indicator Liquidity Sweep Volume, image 2
Trading product for Liquidity Profiler Tools Indicator Liquidity Sweep Volume, image 3
Trading product for Liquidity Profiler Tools Indicator Liquidity Sweep Volume, image 4
Trading product for Liquidity Profiler Tools Indicator Liquidity Sweep Volume, image 5
38
Sales
2.42K
Free installs

Description

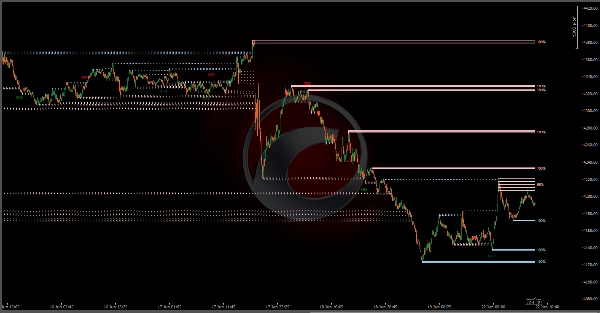
The Liquidity Profiler Tools is indicator identifies major buy-side and sell-side liquidity levels and visualizes internal buyer/seller activity through volume delta-filled quadrants, providing a complete toolkit for analyzing liquidity sweeps and potential reversals.

Detection


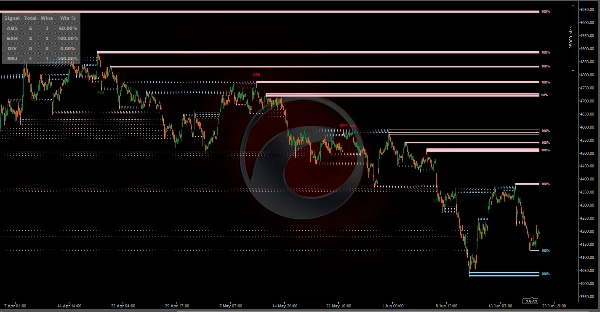
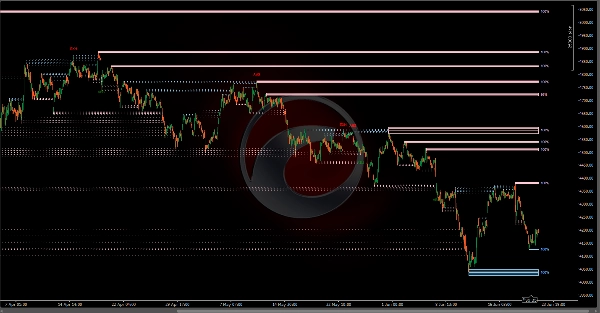
The indicator utilizes a pivot-based detection system. When a swing high is confirmed, a Buy-Side Liquidity (BSL) zone is created; a swing low creates a Sell-Side Liquidity (SSL) zone. The script includes "Filter Overlaps" logic to ensure chart clarity. If a new, more significant pivot forms within the range of an existing active zone, the tool can automatically update to the most relevant level, preventing the clutter of multiple overlapping boxes.

This tool splits each zone into four horizontal quadrants. As price trades within these quadrants, the script calculates the volume delta (the difference between buying and selling pressure) for each specific section.

Buy Zones: Indicates aggressive buyers were more active in that specific price slice.

Sell Zones: Indicates aggressive sellers dominated that section.

Reversal Detection

The script includes an detection system that identifies unusual volume patterns during liquidity sweeps. These signals are displayed as text as follows:

    • ABS (Absorption): Occurs when aggressive market orders at the extreme edge of a zone are absorbed by large limit orders in the opposite direction.
    • EXH (Exhaustion): Occurs when a sweep happens on very low relative volume, suggesting no follow-through.
    • DIV (Divergence): Identified when high volume pushes into the edge of a zone (FOMO) but price fails to close outside the level.
    • REJ (Snapback Rejection): Triggered when a sweep candle shows high delta in the opposite direction of the sweep and closes back inside the zone.

Dashboard:

The indicator includes a real-time dashboard that tracks the historical performance of each reversal signal type using a time-based validation logic.

Win recorded if within the Eval Window, the price reverses from the sweep and remains in profit (on the correct side of the signal entry) for a specific number of consecutive bars (Hold Time). 

Zone Decay (Health):

Active zones feature a "Health" percentage label. This tracks the cumulative volume traded within the zone relative to its capacity. As more volume is transacted at these levels, the liquidity is considered "consumed," and the percentage drops toward 0%.

Indicator Settings

Main Settings

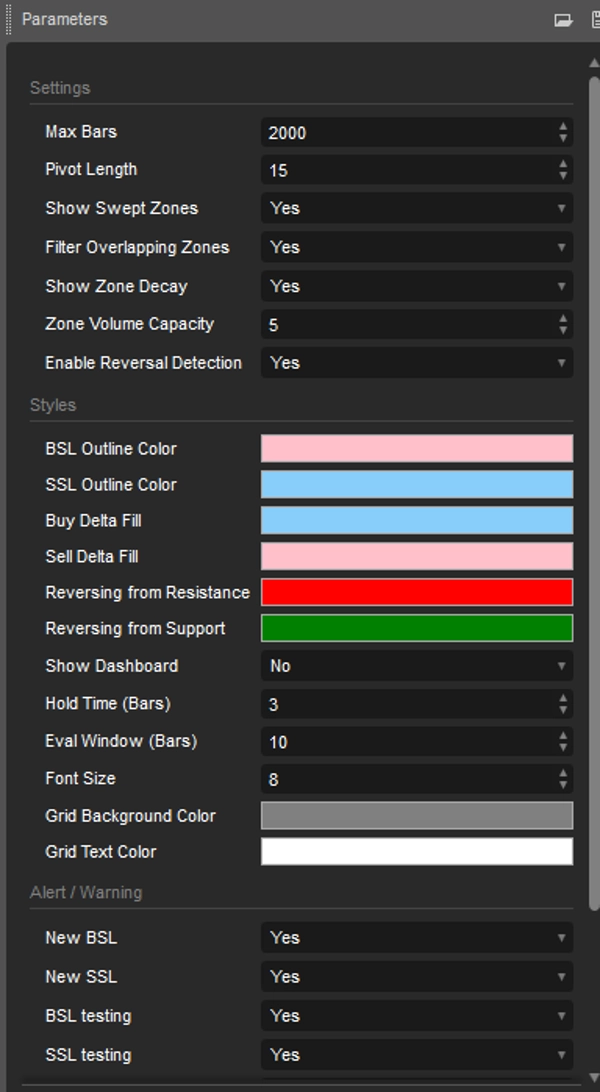
  • Pivot Length: Lookback/lookforward period for detecting swing highs and lows.
  • Max Bars: The indicator starts calculating based on the number of historical candlesticks.
  • Show Swept Zones: Keeps zones visible with dashed outlines after they have been breached.
  • Filter Overlapping Zones: Prevents the creation of new zones that overlap with existing active zones.

Decay & Reversals

  • Show Zone Decay: Toggles the health percentage labels.
  • Zone Volume Capacity: Multiplier for average volume to determine how much volume a zone can absorb.
  • Enable Reversal Detection: Toggles the signal bubbles for reversal patterns.

Dashboard

  • Show Dashboard: Toggles the performance tracking table.
  • Hold Time (Bars): The number of consecutive bars price must stay in profit to be considered a successful reversal.
  • Eval Window (Bars): The maximum number of bars the script waits for a reversal to manifest.

Styles and Alert

  • Styles: Adjust object color configuration. Hide/Show Dashboard.
  • Alert: Turn alerts on/off whenever BSL&SSL is detected/migrated/testing/reversal.

Summary

AI summary
Liquidity Profiler Tools is a trading indicator designed to identify key buy-side and sell-side liquidity levels using a pivot-based detection system. It marks Buy-Side Liquidity (BSL) zones at confirmed swing highs and Sell-Side Liquidity (SSL) zones at swing lows, applying logic to filter overlapping zones for chart clarity. Each liquidity zone is divided into four horizontal quadrants, where volume delta—measuring buying versus selling pressure—is calculated to reveal aggressive buyer or seller activity within specific price ranges.
The tool also detects potential reversal signals during liquidity sweeps, displaying four types of volume-based patterns: Absorption (ABS), Exhaustion (EXH), Divergence (DIV), and Snapback Rejection (REJ). These signals help identify unusual volume behavior that may precede price reversals.
A real-time dashboard tracks the historical performance of reversal signals, validating them based on price action within a user-defined evaluation window and hold time. Active zones feature a "Health" metric indicating the extent of volume consumed relative to zone capacity, reflecting liquidity depletion.
Users can customize settings including pivot length, volume capacity, zone visibility, reversal detection toggles, and dashboard display. The indicator supports visualization of liquidity sweeps and reversals, aiding analysis of support and resistance levels through volume and order flow insights.
Indicator profile
Indicator category
Support & resistance
Output type
Visualisation
Data requirements
Bars only
Supported signals
Trend strength

Customer reviews

0.0
Reviews: 0
Customer reviews
No reviews for this product yet. Already tried it? Be the first to tell others!

Discussion

FAQ

Liquidity Sweep
Volume
Support & Resistance
Products available through cTrader Store, including trading bots, indicators and plugins, are provided by third-party developers and made available for informational and technical access purposes only. cTrader Store is not a broker and does not provide investment advice, personal recommendations or any guarantee of future performance.

More from this author

Indicator
SMC
Forex
+7
The Fair Value Gap (FVG) Indicator identifies inefficiencies in price action where an imbalance occurs due to aggressive
Indicator
SMC
Forex
+7
Simple Smart Money Concepts (SMC)
Indicator
Forex
BTCUSD
+6
The Market Sessions indicator is a popular tool for visually representing global trading sessions on a price chart.
Indicator
SMC
Forex
+5
Pure Price Action ICT Tools
Indicator
MACD
Forex
+5
MACD Indicator with Histogram that plots Colors Based on Direction Above and Below the Zero Line.
Indicator
Forex
BTCUSD
+6
All-In-One solution for ICT's FVG IFVG ORDERBLOCK in advanced mode.
Indicator
Forex
BTCUSD
+4
The Linear Regression Oscillator (LRO) is a technical indicator based on linear regression analysis.
Indicator
Forex
BTCUSD
+5
Simple ICT Concepts
Indicator
Forex
BTCUSD
+5
This indicator displays the OrderBlocks of the current and higher timeframe, made by ICT's student.
Indicator
BOS
MSS
+3
Orderblocks with Multi-Timeframe.
Indicator
Forex
BTCUSD
+4
This indicator is designed to perform multiple non-linear regression analysis using four independent variables.
Indicator
ATR
BOS
+3
Fair Value Gaps with Multi-Timeframe.

You may also like

Indicator
Market Structure
Stop guessing which trading session you in, with Sessions indicator sessions are in your finger tips like a pro
Indicator
Key Levels
Order Block
+2
It monitors trend lines on price charts and fires multi-channel alerts and optionally places trades when price crosses..
Indicator
ZigZag Pro – Multi-Swing Indicator for cTrader Description: ZigZag Pro is a powerful and fully customizable swing indica
Indicator
SMC
Prop
+17
Unlock the true intent of market participants with the Classic Proportional Cumulative Volume Delta CVD!
Indicator
BOS
EMA
+5
Directional volume heatmap: see if a price zone was built on buying or selling, not just how much.
Indicator
Customize your Moving Average! Choose any timeframe and price source for precision and flexibility in your analysis.
Indicator
Flag
VWAP
+5
Session VWAP with statistical deviation bands, gradient cloud, and live rejection alerts — see exactly how stretched pri
Indicator
Prop
Forex
+5
Tracks NY, London, Tokyo, Sydney sessions with custom visuals, and a real-time expanding range box and breakout High/Low
Indicator
The Weekly Daily Levels indicator shows the OHLC, and mid-point prices for the previous day and week.
Indicator
Three ZigZag lines
Indicator
Prop
Forex
+13
Volume Meter
Indicator
ATR
RSI
+16
Highlight market consolidation zones instantly with this Inside Candle indicator — precise, clean, and powerful.
Indicator
ATR
RSI
+16
This trading game allows you to explore and practice investment strategies in a real-time market data environment.
Indicator
Forex
BTCUSD
+10
Enhance trading with TSI! Use the True Strength Index for clear insights into market momentum and trend strength.
Indicator
SMC
Forex
+13
MultiFrameCandles para cTrader: La Herramienta Definitiva para Dominar Cualquier Marco de Tiempo
Indicator
AI
Signal
+1
🔥 THIS BURNS JP225 INDICATOR – Professional Trading Signals
Indicator
ATR
BTCUSD
+5
Trailing algo 📈 auto-tracks trends 🎯 adapts to volatility 🌟 precise moves 🛡️ retest signals 🚀 no lag, smart market
Indicator
Indices
Custom ADX Indicator for precise trend analysis. المؤشر المخصص ADX لتحليل الاتجاه بدقة

Price

38
Sales
2.42K
Free installs