
Beschreibung
Was ist ein Trendlinien-Indikator?
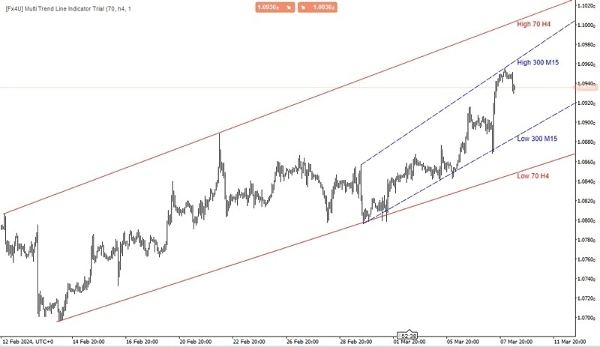
Ein Trendlinien-Indikator ist ein Werkzeug der technischen Analyse, das von Händlern und Analysten verwendet wird, um die Richtung und Stärke eines Trends auf einem Finanzmarkt zu identifizieren. Er basiert auf dem Zeichnen einer geraden Linie, die zwei oder mehr Preis-Punkte auf einem Chart verbindet. Der Hauptzweck einer Trendlinie ist es, die allgemeine Richtung der Kursbewegung über einen bestimmten Zeitraum visuell darzustellen.
Multi-Timeframe-Trendlinien-Indikator
Die Hauptfunktion eines Multi-Timeframe-Trendlinien-Indikators besteht darin, Händlern eine breitere Perspektive der Markttrends zu bieten, indem Informationen aus verschiedenen Zeitrahmen aggregiert werden. Durch die Analyse von Trends über mehrere Zeitrahmen hinweg können Händler fundiertere Entscheidungen über potenzielle Ein- und Ausstiegspunkte sowie die allgemeine Marktrichtung treffen.
Dieser Indikatortyp ermöglicht es Händlern typischerweise, die Zeitrahmen, die sie analysieren möchten, anzupassen und entsprechend Trendlinien zu zeichnen. Er kann ein wertvolles Werkzeug sein, um wichtige Unterstützungs- und Widerstandsniveaus, Trendwenden und Trendfortsetzungen über verschiedene Zeitrahmen hinweg zu identifizieren und unterstützt Händler so bei genaueren Handelsentscheidungen.
Es gibt mehrere Arten von Trendlinien, darunter:
- Aufwärtstrendlinie: Diese wird gezeichnet, indem zwei oder mehr aufeinanderfolgende Tiefpunkte auf einem Kurschart verbunden werden. Sie deutet auf einen Aufwärtstrend hin, was bedeutet, dass die Preise im Allgemeinen im Laufe der Zeit steigen.
- Abwärtstrendlinie: Im Gegensatz dazu wird eine Abwärtstrendlinie gezeichnet, indem zwei oder mehr aufeinanderfolgende Hochpunkte auf einem Kurschart verbunden werden. Sie deutet auf einen Abwärtstrend hin, was bedeutet, dass die Preise im Allgemeinen im Laufe der Zeit fallen.
- Horizontale Trendlinie: Auch bekannt als Unterstützungs- oder Widerstandslinien, werden diese horizontal gezeichnet, um Bereiche anzuzeigen, in denen die Kursbewegung dazu neigt, zu stagnieren oder sich umzukehren.
Händler verwenden Trendlinien oft in Kombination mit anderen technischen Indikatoren und Analysemethoden, um fundierte Handelsentscheidungen zu treffen. Wenn eine Trendlinie durchbrochen oder verletzt wird, kann dies auf eine potenzielle Richtungsänderung des Trends hinweisen und Handelssignale für Investoren liefern.
Meine anderen Produkte:
https://ctrader.com/products/346
https://ctrader.com/products/336
https://ctrader.com/products/343
https://ctrader.com/products/347
https://ctrader.com/products/148
Zusammenfassung
This multi-timeframe indicator aggregates trend information across customizable timeframes, providing a comprehensive market overview. It supports the identification of upward, downward, and horizontal trendlines, which correspond to rising trends, falling trends, and support or resistance levels, respectively. By integrating trendlines from various timeframes, traders can better detect trend continuations, reversals, and key support/resistance zones.
The indicator assists in making informed trading decisions by highlighting potential entry and exit points based on trendline breaks or breaches. It is intended for use alongside other technical indicators and analysis methods to enhance market interpretation and trading accuracy.
Kundenbewertungen
5 | 67 % | |
4 | 0 % | |
3 | 33 % | |
2 | 0 % | |
1 | 0 % |
![„[Fx4U] GBPUSD - Price Action“-Logo](https://cdn.ctrader.com/image/webp/d80b34fc-da3c-4f01-a321-456450665649_26190)

![„[Fx4U] CADJPY - Price Action“-Logo](https://cdn.ctrader.com/image/webp/1ba81247-b6b7-4f3c-a297-fa3eb1d57fe1_26195)

![„[Fx4U] AUDCHF - Price Action“-Logo](https://cdn.ctrader.com/image/webp/0a22e9aa-c83b-42cd-b0b8-c1a2da593207_26148)

![„[Fx4U] EURAUD - Price Action“-Logo](https://cdn.ctrader.com/image/webp/baf8dde4-1ef3-4beb-8ae2-0fed8320f65d_26177)


![„High-Low Divergence [Iridio Capital]“-Logo](https://cdn.ctrader.com/image/webp/443c4661-7abb-40f1-842f-4b6ec560649b_40914)


