
Beschreibung
⚠️Aktualisierung, genießen Sie echte Tiefeninformationen⚠️
🔥 HEAT MAP DASHBOARD 📈
Ein institutionelles Order Flow & Momentum Terminal für cTrader.
Das Heat Map Dashboard ist nicht nur eine einfache Chart-Überlagerung – es ist ein dreiteiliges Trading-Ökosystem, das direkt in Ihre Plattform integriert ist. Es gibt Ihnen eine "Röntgen"-Sicht auf die Marktliquidität, echte volumengewichtete Durchschnitte und makroökonomische Trends, alles ohne Ihren Computer zu verlangsamen. ⚡
🎯 Was es tut (Die Sicht des Traders)
Das System unterteilt Ihr Trading in drei einfache Schritte:
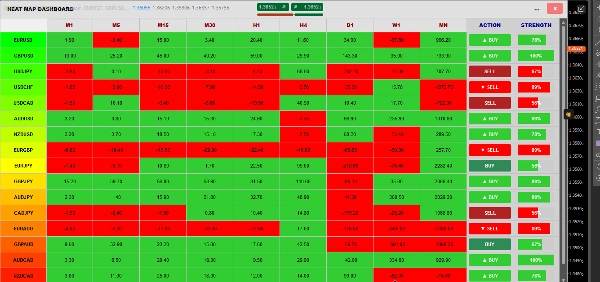
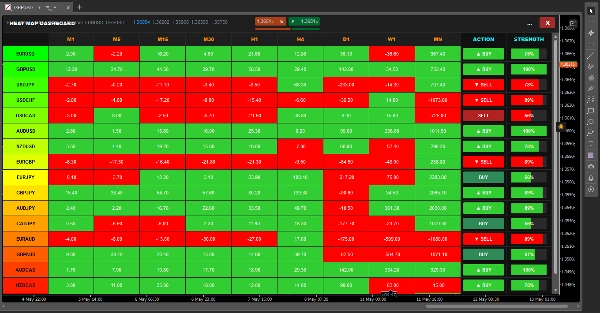
- 🎛️ Schritt 1: WAS gehandelt wird (Die Matrix). Anstatt durch Dutzende von Charts zu klicken, scannt das Dashboard 17 verschiedene Assets über 9 Zeitrahmen (M1 bis monatlich). Es berechnet das Momentum für jede einzelne Zelle und färbt sie ein. Auf einen Blick wissen Sie genau, welches Paar sich in einem starken Trend befindet und bereit zum Handeln ist.
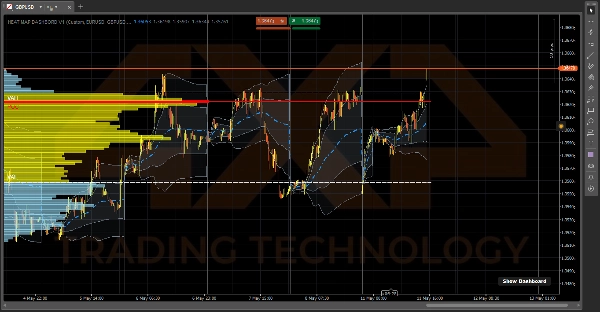
- 🌊 Schritt 2: WER die Kontrolle hat (Der VWAP). Sobald Sie ein Paar ausgewählt haben, schauen Sie sich den Daily Anchored VWAP an. Er zeigt Ihnen den echten Durchschnittspreis basierend auf Volumen, nicht nur Kerzencharts. Die schattierten Standardabweichungswolken fungieren als dynamische Unterstützung/Widerstand und zeigen Ihnen genau, wann der Markt stark überkauft oder überverkauft ist.
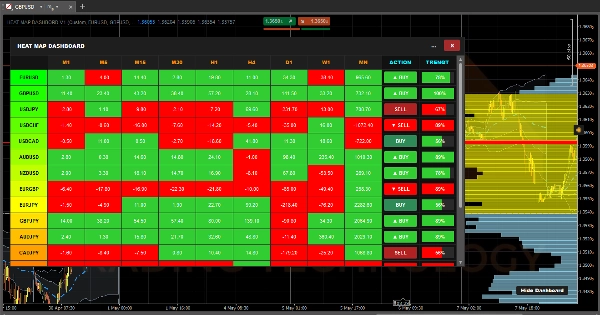
- 📊 Schritt 3: WO man einsteigt (Der VRVP). Schließlich zeigt das Visible Range Volume Profile genau, wo die schwere institutionelle Liquidität liegt. Es zeichnet automatisch Ihren Point of Control (POC) und 70% Value Area (VAH & VAL) Linien, die Ihnen punktgenaue Levels für Ein- und Ausstiege bieten.
⚙️ Wie es funktioniert (Unter der Haube)
Die meisten Indikatoren, die so viele Berechnungen durchführen, würden Ihre Plattform sofort einfrieren und cTrader auf 100% CPU-Auslastung bringen. Um das zu verhindern, wird das Heat Map Dashboard von drei hochoptimierten, unabhängigen Engines gleichzeitig betrieben:
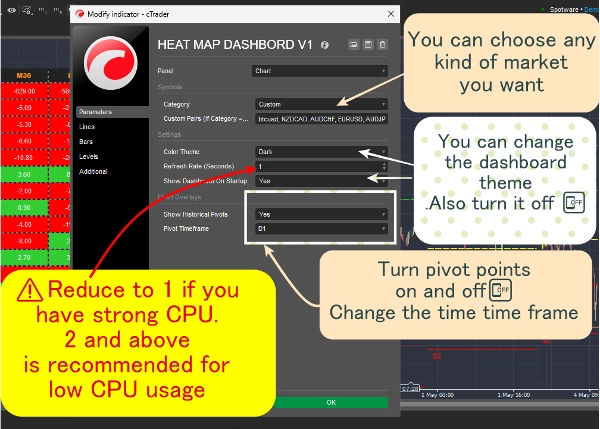
1. Die Dashboard-Engine (Der 2-Sekunden-Herzschlag) ⏱️ Wenn wir 153 Kombinationen (17 Paare x 9 Zeitrahmen) bei jedem einzelnen Preistick berechnen würden, würde Ihr Computer überhitzen. Stattdessen läuft diese Engine auf einem strikten 2-Sekunden-Herzschlag-Timer. Alle 2 Sekunden schaut sie stillschweigend auf den Preis von vor 14 Kerzen, vergleicht ihn mit dem aktuellen Preis und färbt die Zelle grün (positives Momentum) oder rot (negatives Momentum).
2. Die VRVP-Engine (Der Bildschirmleser) 🖥️ Anstatt Tausende von Balken historischer Daten zu laden, fungiert das Volume Profile als dynamischer "Viewport Listener". Es wird nur aktiv, wenn Sie physisch in Ihr Chart hineinzoomen oder scrollen. Es fragt cTrader genau, welche Kerzen aktuell auf Ihrem Bildschirm sichtbar sind, berechnet das genaue Volumen-Überlappen für diese spezifischen Balken und zeichnet sofort die 70% Value Area neu.
3. Die VWAP-Engine (Der Tick-Akkumulator) 🧮 Der VWAP ist das Einzige, das auf dem Live-Tick berechnet wird. Um jedoch blitzschnell zu bleiben, verwendet er eine leichte "Kumulative Datenreihe". Anstatt den ganzen Tag jede Sekunde neu zu berechnen, fügt er einfach das Volumen des neuen Ticks zu einem laufenden Hintergrundtotal hinzu und löscht sich automatisch genau in dem Moment, wenn die Uhr Mitternacht schlägt.
4. Der Fenster-Manager (Der Formwandler) 🪟 Das Dashboard ist in eine benutzerdefinierte C#-Größenlogik eingebettet, die aktiv auf Ihren Monitor hört. Wenn Sie die Maximieren [ ] oder Wiederherstellen [=] Schaltflächen drücken, liest der Indikator dynamisch Ihre Chart.Width und Chart.Height in Echtzeit aus und passt sich sofort perfekt an Ihren Bildschirm an, ohne zusammenzufallen!
Zusammenfassung
1. Market Momentum Matrix: Scans 17 assets across 9 timeframes (from 1 minute to monthly), calculating and color-coding momentum to identify trending pairs quickly.
2. Daily Anchored Volume Weighted Average Price (VWAP): Displays true average prices weighted by volume, with dynamic standard deviation clouds indicating overbought or oversold conditions.
3. Visible Range Volume Profile (VRVP): Maps institutional liquidity by highlighting the Point of Control (POC) and 70% Value Area (VAH & VAL) within the visible chart range, aiding precise entry and exit levels.
The dashboard operates via four optimized engines: a 2-second heartbeat engine for momentum updates, a viewport-driven VRVP engine for volume profile recalculations, a tick-accumulating VWAP engine for real-time volume-weighted pricing, and a dynamic window manager that adjusts the interface to fit the chart size. This architecture ensures efficient performance and real-time responsiveness. The indicator supports visualization, signals (including trend strength, breakouts, and reversals), and filtering based on tick data, volume, and market structure analysis. It is tagged for aggressive trading, market structure, liquidity sweeps, support/resistance, and risk dashboard functionalities.
Kundenbewertungen
5 | 100 % | |
4 | 0 % | |
3 | 0 % | |
2 | 0 % | |
1 | 0 % |


