
Descrição
| ALL IN ONE TRADING PRO|
## O Que É Este Indicador?
Este indicador coloca **três ferramentas úteis de negociação** no seu gráfico ao mesmo tempo. Pense nisso como ter três traders especialistas dando sua opinião ao mesmo tempo
=====================================================
## As Três Ferramentas
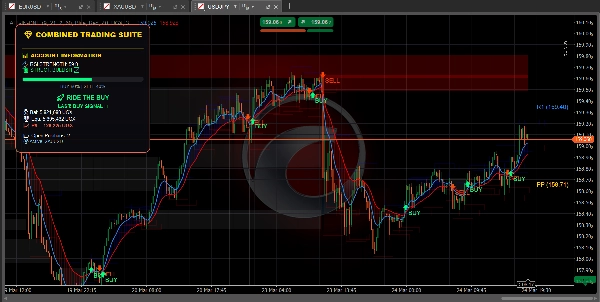
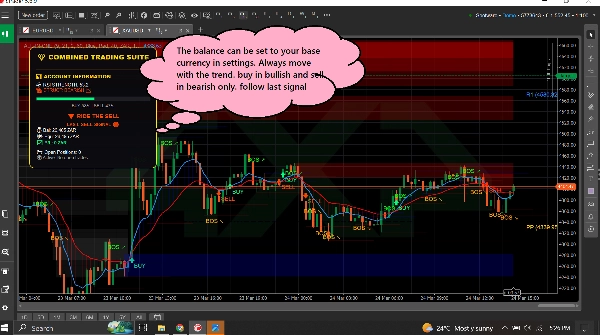
### 1. PAINEL DE TENDÊNCIA (O Rastreador de Tendência)
**O que faz:** Indica para você em qual direção o mercado está se movendo e quão forte é o movimento.
**O que você vê:**
- **Linha azul** = Média móvel rápida (tendência de curto prazo)
- **Linha vermelha** = Média móvel lenta (tendência de longo prazo)
- **Nuvem azul** = Tendência de alta (preço subindo)
- **Nuvem vermelha** = Tendência de baixa (preço descendo)
- **Seta verde** = Aparece sinal de COMPRA
- **Seta vermelha** = Aparece sinal de VENDA
- **Barra RSI** = Mostra se o mercado está sobrecomprado (muito alto) ou sobrevendido (muito baixo)
========================================================
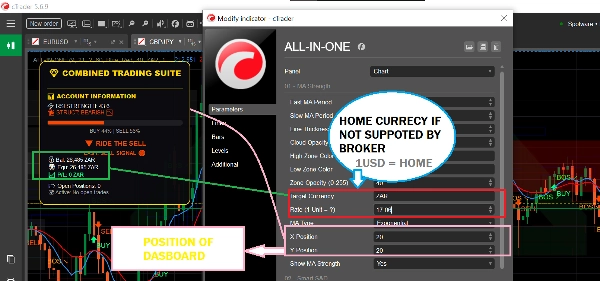
**Também mostra:**
- Seu saldo de conta e lucro/prejuízo
- Quantas posições você tem abertas
- Conselhos simples em texto como "SEGURO PARA COMPRAR" ou "APROVEITE A COMPRA"
============================================================
### 2. ZONAS DE OFERTA & DEMANDA (O Localizador de Níveis-Chave)
**O que faz:** Encontra níveis importantes de preço onde o mercado pode reverter ou parar.
**O que você vê:**
- **Caixas azuis** = Zonas de demanda (áreas onde compradores entram - BOM para comprar)
- **Caixas vermelhas** = Zonas de oferta (áreas onde vendedores entram - BOM para vender)
- **Caixas cinzas** = Zonas que foram testadas (menos confiáveis)
============================================================
**Como usar:**
- Preço descendo em direção a uma caixa azul? Procure COMPRAR
- Preço subindo em direção a uma caixa vermelha? Procure VENDER
- Caixas novas (brilhantes) funcionam melhor que as cinzas
============================================================
**Também mostra:**
- **BOS ↗** = Mercado rompeu para cima, a tendência pode continuar subindo
- **BOS ↘** = Mercado rompeu para baixo, a tendência pode continuar descendo
============================================================
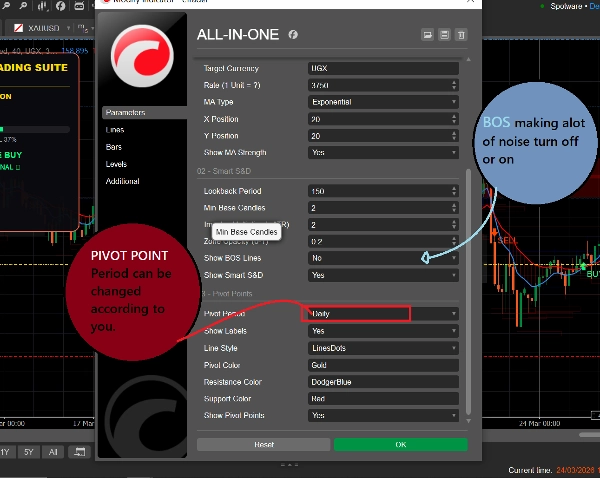
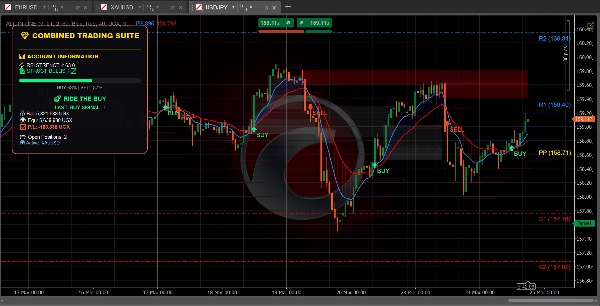
### 3. PONTOS DE PIVÔ (Os Níveis de Suporte & Resistência)
**O que faz:** Calcula níveis automáticos de preço onde o mercado frequentemente para ou reverte.
**O que você vê:**
- **Linha dourada** = Ponto de pivô (nível central)
- **Linhas azuis** = Níveis de resistência (o preço pode cair aqui)
- **Linhas vermelhas** = Níveis de suporte (o preço pode subir aqui)
============================================================
**Você pode escolher:**
- **Diário** = Níveis mudam uma vez por dia
- **Semanal** = Níveis mudam uma vez por semana
- **Mensal** = Níveis mudam uma vez por mês
- **15-Minutos** = Níveis mudam a cada 15 minutos (bom para negociações rápidas)
============================================================
## Como Usar (Simples)
### Para Encontrar uma Negociação DE COMPRA:
1. Espere o preço alcançar uma **caixa azul de demanda**
2. Verifique se a linha MA azul está acima da linha MA vermelha (tendência de alta)
3. Os sinais devem ser seguidos somente se o mercado estiver na tendência correta
============================================================
### Para Encontrar uma Negociação DE VENDA:
1. Espere o preço alcançar uma **caixa vermelha de oferta**
2. Verifique se a linha MA vermelha está acima da linha MA azul (tendência de baixa)
3. Os sinais devem ser seguidos somente se o mercado estiver na tendência correta
============================================================
### Para Encontrar Negociações Rápidas:
1. Use pontos de pivô de 15 minutos para níveis precisos
2. Observe as setas BOS para direção da tendência
3. Verifique o painel para força do mercado
4. Faça negociações que correspondam à direção
============================================================
## O Que Todos as Cores Significam
| Cor | O Que Significa |
| 🟦 Azul | Sinais de alta / Compra / Zonas de demanda / Pivôs de resistência |
| 🔴 Vermelho | Sinais de baixa / Venda / Zonas de oferta / Pivôs de suporte |
| 🟨 Dourado | Ponto de pivô (nível central) |
| ⚪ Cinza | Zonas testadas (já visitadas) |
| 🟢 Seta Verde | Sinal de COMPRA |
| 🔴 Seta Vermelha | Sinal de VENDA |
============================================================
## Configurações Simples para Iniciantes
============================================================
### Para Negociação Rápida (Scalping):
- Período do Pivô: **15-Minutos**
- MA Rápida: **5**
- MA Lenta: **13**
- Ativar: As três ferramentas
============================================================
### Para Negociação Diária:
- Período do Pivô: **Diário**
- MA Rápida: **9**
- MA Lenta: **21**
- Ativar: As três ferramentas
============================================================
### Para Negociação de Longo Prazo:
- Período do Pivô: **Semanal**
- MA Rápida: **21**
- MA Lenta: **55**
- Ativar: Painel de Tendência + Pontos de Pivô
=========================================================
## Uma Regra para Lembrar
=========================================================
**Não negocie quando as ferramentas discordarem!**
Se o painel indicar COMPRA, mas o preço estiver em uma zona vermelha de oferta - espere por clareza.
Se o painel indicar VENDA, mas o preço estiver em uma zona azul de demanda - espere por clareza.
As melhores negociações acontecem quando TODAS as ferramentas apontam na mesma direção.
============================================================
## Início Rápido
1. Adicione o indicador ao seu gráfico
2. Mantenha todas as configurações no padrão para começar
3. Observe como o preço se comporta nas caixas e linhas coloridas
4. Após alguns dias, ajuste as configurações para combinar com seu estilo
5. Use o painel para monitorar sua conta em tempo real
============================================================
É isso! Três ferramentas, um indicador, negociação simples.
Resumo
1. Trend Dashboard: Displays short-term (blue line) and long-term (red line) moving averages, colored clouds indicating uptrend (blue) or downtrend (red), buy (green arrow) and sell (red arrow) signals, and an RSI bar showing overbought or oversold conditions. It also shows account balance, open positions, and simple text advice.
2. Supply & Demand Zones: Highlights important price levels with blue boxes for demand zones (buying areas), red boxes for supply zones (selling areas), and gray boxes for tested zones (less reliable). It includes breakout signals (BOS arrows) indicating potential trend continuation.
3. Pivot Points: Automatically calculates support and resistance levels with a gold pivot point line, blue resistance lines, and red support lines. Users can select pivot periods from 15-minute to monthly intervals for different trading styles.
The indicator supports multiple markets including Forex, Crypto, Stocks, and Indices, and provides visual signals such as crossovers, breakouts, and level touches. It is designed for various trading styles, from scalping to long-term trading, with recommended settings for each. The tool emphasizes trading only when all three components align in direction to improve trade clarity and consistency.
Avaliações de clientes
5 | 100 % | |
4 | 0 % | |
3 | 0 % | |
2 | 0 % | |
1 | 0 % |


