
Descrição
🔧 ATR_RR_SignalPanel — Descrição Técnica & Detalhada (EN) 🧠📈
ATR_RR_SignalPanel é um indicador sobreposto para cTrader que gera sinais de entrada de mudança de tendência usando um regime Fast EMA vs Slow EMA, depois constrói uma estrutura completa de negociação virtual (Entrada 🏁, Stop Loss 🛑, Take Profit Final 🎯, Alvos Intermediários 🟢) usando dimensionamento de risco baseado em ATR e um multiplicador configurável de Risco:Recompensa ⚖️.
🧭 Lógica Central (Motor de Sinal) 🚦
- O indicador calcula:
-
- Fast EMA ⚡ e Slow EMA 🐢 no Fechamento.
- ATR (suavização Wilder) 🌡️ para distância de stop baseada em volatilidade.
- Um regime de tendência é definido como:
-
- Tendência de alta 🟢 quando
Fast EMA > Slow EMA - Tendência de baixa 🔴 quando
Fast EMA < Slow EMA
- Tendência de alta 🟢 quando
- Uma Mudança de Tendência 🔁 é acionada quando o estado de alta/baixa diferir da barra anterior (equivalente ao Pine’s
bullTrend != bullTrend[1]).
🎯 Condições de Entrada (COMPRA/VENDA) 🟩🟥
Quando ocorre uma mudança de tendência:
- Sinal de COMPRA 🟢 se:
-
- Tendência de alta está ativa e uma mudança de tendência é detectada
- Confirmação opcional de candle ✅: Fechamento > Abertura (candle de alta)
- Sinal de VENDA 🔴 se:
-
- Tendência de baixa está ativa e uma mudança de tendência é detectada
- Confirmação opcional de candle ✅: Fechamento < Abertura (candle de baixa)
🧪 Gestão Virtual de Posição (Não é um cBot) 🧩
Este indicador não executa ordens. Em vez disso, simula uma “posição virtual” interna:
- Em um novo sinal de COMPRA/VENDA ele define:
-
- Preço de Entrada = fechamento atual 🏁
- Stop Loss = extremo do candle ± ATR × multiplicador 🛑
- Take Profit Final = Entrada ± (Risco × RiscoRecompensa) 🎯
- Níveis intermediários de TP = passos em 1R, 2R, … até floor(RR)-1 🟢
- Ele monitora a ação do preço barra a barra:
-
- Se TP final for atingido ➜ marca 🎯 e fecha a posição virtual ✅
- Se SL for atingido ➜ marca 🛑 e fecha a posição virtual ❌
- Acertos intermediários de TP são rastreados apenas uma vez 🧷
🔁 Lógica de Invalidação (Sinal Oposto Enquanto Ativo) ⚠️
Se um novo sinal chegar enquanto existe uma negociação virtual na direção oposta:
- A entrada anterior é marcada como INVALIDADA ⚠️ (INV COMPRA / INV VENDA)
- A posição virtual anterior é encerrada 🧯
- Uma nova posição virtual é criada na nova direção 🔄
🧼 Seguro para Multi-Instância (Múltiplas Cópias no Mesmo Gráfico) 🧩🧩
Cada instância do indicador gera um ID interno único 🆔, então:
- Linhas/textos de uma instância não sobrescrevem outra instância ✅
- Você pode executar várias configurações em paralelo (ex.: scalping + swing) 🧠📊
🧯 Controles Anti-Desordem (Limitador de Marcadores) 🧹✨
Para manter os gráficos legíveis, ele pode:
- Limitar o número de marcadores de texto desenhados (COMPRA/VENDA/TP/SL/INV/TP1…) 🧾
- Excluir automaticamente marcadores antigos quando o limite for excedido ♻️
🧷 “Manter Últimas Linhas de Risco” Opcional 🧠📌
Quando ativado, as últimas linhas de Entrada/SL/TP permanecem visíveis mesmo após o fechamento TP/SL:
- Ótimo para revisão pós-negociação 🧑🔬
- Ótimo para registro em diário 📒✅
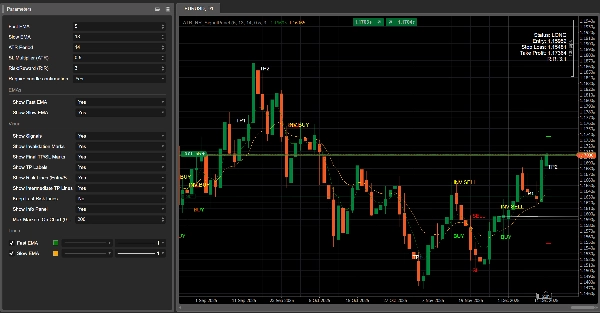
⚙️ Parâmetros — Explicação Detalhada (EN) 🔍📌
📈 Núcleo de Sinal & Risco
⚡ Fast EMA
- O que faz 🧠: Define o período da fast EMA usada para detectar mudanças de regime.
- Efeito 📊: Valores menores = mais reativo ➜ mais sinais; maiores = mais suave ➜ menos sinais.
- Faixas típicas 🎛️: 3–10 para mercados rápidos ⚡, 10–20 para configurações mais calmas 🐢
🐢 Slow EMA
- O que faz 🧠: Define o período da slow EMA usada como base da tendência.
- Efeito 📊: Slow EMA maior = filtragem mais forte ➜ menos gatilhos de mudança de tendência.
- Faixas típicas 🎛️: 13–55 dependendo do estilo 🧭
🌡️ Período ATR
- O que faz 🧠: Controla o comprimento da medição de volatilidade para ATR.
- Efeito 📏: ATR curto reage rápido (SL mais apertado), ATR longo estabiliza (SL mais estável).
- Faixas típicas 🎛️: 10–21 é comum ✅
🛑 Multiplicador SL (ATR)
- O que faz 🧠: Define a distância do Stop Loss em unidades ATR.
- Longo 🟢:
SL = Low - ATR * Mult - Curto 🔴:
SL = High + ATR * Mult - Efeito 🎯: Multiplicador maior = SL mais amplo (menos stops, risco maior); menor = SL mais apertado (mais stops).
- Valores típicos 🎛️: 0.3–2.0 dependendo da volatilidade 🌪️
⚖️ Risco:Recompensa (R:R)
- O que faz 🧠: Multiplica a distância do “risco” para calcular o TP final.
- Fórmula 📌:
-
- Risco = |Entrada − SL|
- TP Final = Entrada ± Risco × RR 🎯
- TPs Intermediários 🟢: TP1 em 1R, TP2 em 2R, … até
floor(RR)-1 - Exemplo 🧪: RR=3 ➜ TP1 (1R), TP2 (2R), TP Final (3R) 🎯🎯🎯
✅ Requer confirmação de candle
- O que faz 🧠: Adiciona validação da direção do candle na barra do sinal.
- COMPRA 🟢: requer Fechamento > Abertura
- VENDA 🔴: requer Fechamento < Abertura
- Efeito 🧽: Filtra reversões fracas, reduz ruído, pode entrar mais tarde ⏳
📌 Exibição das EMAs
👁️ Mostrar Fast EMA
- O que faz 🧠: Mostra/oculta a linha da fast EMA.
- Caso de uso 💡: Oculte se quiser um gráfico limpo 🧼
👁️ Mostrar Slow EMA
- O que faz 🧠: Mostra/oculta a linha da slow EMA.
- Caso de uso 💡: Mantenha visível para contexto de tendência 🧭
🎛️ Controles Visuais (Gestão de Desordem) 🧹✨
🚦 Mostrar Sinais
- O que faz 🧠: Mostra/oculta marcadores de COMPRA/VENDA.
- Inclui 🧷: marcadores COMPRA 🟢 / VENDA 🔴 (apenas)
- Dica 💡: Desative para modo “apenas linhas” 📏
🏷️ Mostrar Rótulos de TP
- O que faz 🧠: Mostra/oculta rótulos como TP1, TP2…
- Efeito 🧼: Desligar remove muito ruído de texto em TFs maiores 📉
- Nota 🧷: Rótulos aparecem apenas uma vez por acerto de TP ✅
⚠️ Mostrar Marcas de Invalidação
- O que faz 🧠: Mostra/oculta marcadores INV COMPRA / INV VENDA.
- Caso de uso 🧠: Útil quando quiser estudar reversões de sinal 🔁
🎯🛑 Mostrar Marcas Finais de TP/SL
- O que faz 🧠: Mostra/oculta marcadores finais de TP e SL.
- Caso de uso 📒: Ótimo para revisar a distribuição dos resultados 🎲
📏 Mostrar Linhas de Risco (Entrada/SL/TP)
- O que faz 🧠: Desenha linhas de Entrada 🏁, SL 🛑, TP Final 🎯 no gráfico.
- Efeito 📌: Visualiza instantaneamente a estrutura da negociação virtual 🧠
🟢 Mostrar Linhas Intermediárias de TP
- O que faz 🧠: Desenha linhas pontilhadas para níveis TP1/TP2/...
- Dica 🧼: Desative se o gráfico ficar muito “espaguete verde” 🍝🟢
📌 Manter Últimas Linhas de Risco
- O que faz 🧠: Mantém as últimas linhas de Entrada/SL/TP visíveis após saída virtual (TP/SL).
- Por que é útil 📒: Perfeito para registro em diário & análise pós-negociação 🧑🔬✅
🧾 Máximo de Marcadores no Gráfico (0=ilimitado)
- O que faz 🧠: Limita quantos objetos de texto o indicador deixa no gráfico.
- Como funciona ♻️: Quando o limite é excedido, os marcadores mais antigos são removidos automaticamente.
- Recomendado 🎛️: 80–200 dependendo do timeframe e profundidade do histórico 🕰️
🧾 Mostrar Painel de Informações
- O que faz 🧠: Exibe um painel de status compacto no gráfico.
- Mostra 📋: Status (LONGO/CURTO/Sem Posição), Entrada, SL, TP, RR calculado.
Resumo
The indicator simulates virtual trades by setting entry price, stop loss, and take profit levels using Average True Range (ATR) for volatility-based risk sizing combined with a configurable risk-to-reward multiplier. It tracks intermediate take profit levels and monitors price action bar-by-bar to mark virtual trade outcomes without placing actual orders.
Key features include optional candle confirmation for signals, multi-instance support to run multiple configurations on the same chart, and visual clutter controls such as limiting markers and toggling display of EMAs, signals, and risk lines. An info panel provides a compact status overview of virtual positions. Parameters allow customization of EMA periods, ATR period, stop loss multiplier, and risk-reward ratio to adapt to different trading styles and market conditions.
Supported markets include Forex, indices, commodities, stocks, and cryptocurrencies, with symbols like GBPUSD, EURUSD, XAUUSD, NAS100, and BTCUSD among the tagged assets.
Avaliações de clientes
5 | 100 % | |
4 | 0 % | |
3 | 0 % | |
2 | 0 % | |
1 | 0 % |


