
Descrição
Apresentação do Marketplace (curta)
Volume Delta & CVD — Leia o fluxo agressivo em tempo real. Reinicializações flexíveis (Dia/Semana/Mês), suavização EMA opcional e delta cumulativo que não repinta. Perfeito para confirmar rompimentos e identificar divergências.
Volume Delta & CVD — Guia de Revisão e Parâmetros
Slogan: Meça o desequilíbrio de compra/venda (Delta) e seu fluxo cumulativo (CVD) com reinicializações flexíveis. Não repinta.
Visão Geral
Volume Delta & CVD para cTrader calcula, por barra, o Delta (compra agressiva vs venda) e o CVD (Delta de Volume Cumulativo). Ajuda você a ler a pressão do fluxo de ordens, confirmar rompimentos e identificar divergências em relação ao preço.
Nota: O indicador usa TickVolume (padrão do cTrader) como proxy de volume.
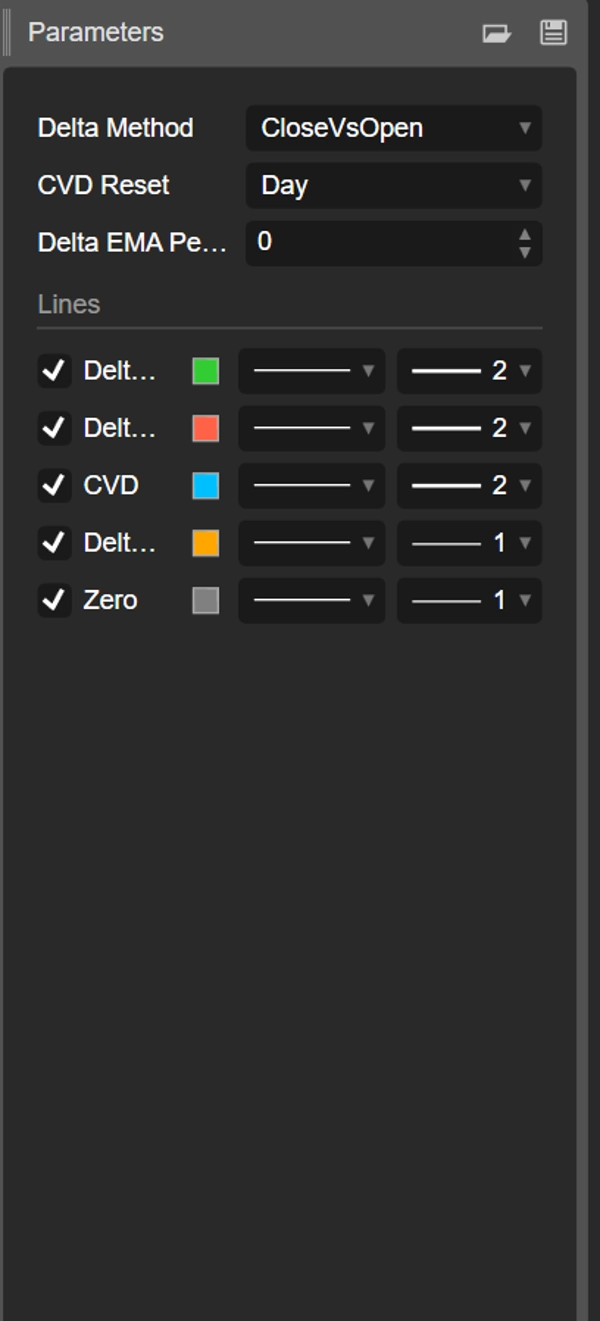
Parâmetros (detalhados)
Método Delta
Escolha como o fluxo direcional da barra é estimado:
- CloseVsPrevClose
Delta = ±TickVolume dependendo de Close[t] vs Close[t-1].
Prós: muito responsivo; ótimo para mudanças de regime intradiárias. - CloseVsOpen
Delta = ±TickVolume dependendo de Close vs Open da mesma barra.
Prós: destaca barras direcionais; reduz ruído entre barras. - Multiplicador do Fluxo de Dinheiro (MFM)
MFM = ((Close−Low) − (High−Close)) / (High−Low)em [−1, +1]
Delta = MFM × TickVolume
Prós: ponderação intra-barra; suave/robusto quando os intervalos são amplos.
Reinicialização do CVD
Controla quando o contador cumulativo reinicia:
- Nenhuma: contínua desde o início do gráfico.
- Dia: reinicia a cada novo dia (viés intradiário).
- Semana: reinicia a cada nova semana (swing).
- Mês: reinicia a cada novo mês (viés de timeframe maior).
Período EMA do Delta (0 = desligado)
- Aplica uma EMA ao Delta para suavizar o histograma e revelar mudanças de regime.
- Sugestões: 5–9 scalping, 10–21 intradiário, 21–34 swing.
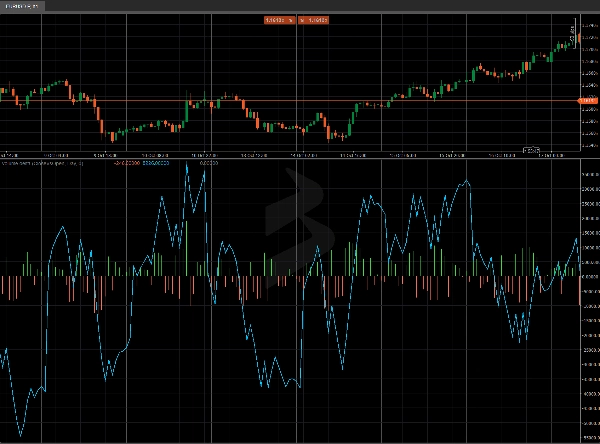
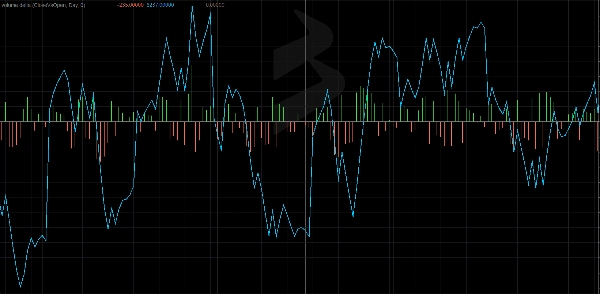
Saídas / Buffers
- Delta Up (histograma verde): parte positiva do Delta.
- Delta Down (histograma vermelho): parte negativa do Delta.
- CVD (linha aqua): soma cumulativa do Delta com a reinicialização escolhida.
- Delta EMA (linha laranja, opcional): Delta suavizado.
- Zero (linha cinza): linha base para comparação rápida.
Como Ler
- Delta > 0 → domínio agressivo de compra na barra.
- Delta < 0 → domínio agressivo de venda na barra.
- CVD crescente → acumulação; CVD decrescente → distribuição.
- Divergências
-
- O preço faz máximas mais altas enquanto o CVD não confirma → possível exaustão da pressão de compra.
- O preço faz mínimas mais baixas enquanto o CVD não confirma → possível exaustão da pressão de venda.
Guias Práticos
- Confirmação de rompimento: prefira rompimentos de alta quando o CVD acelera e o Delta EMA fica positivo.
- Reversão de extensões: procure divergências preço vs CVD em níveis-chave (VWAP/VWAP Ancorado, S/R).
- Viés da sessão: com Reinicialização do CVD = Dia, leia a direção intradiária dominante.
Início Rápido
- Anexe o indicador.
- Comece com Método Delta = MFM, Reinicialização do CVD = Dia, EMA = 10 (intradiário).
- Em gráficos ruidosos, aumente a EMA ou mude para CloseVsOpen.
- Busque confluência com VWAP Ancorado, S/R estático/dinâmico ou padrões de ação de preço.
Desempenho & Compatibilidade
- APIs modernas (
Bars.*,LineColor). - Cálculos que não repintam.
- Funciona em qualquer símbolo e timeframe.
Resumo
The indicator supports three Delta calculation methods: CloseVsPrevClose (responsive for intraday shifts), CloseVsOpen (reduces noise by focusing on directional bars), and Money Flow Multiplier (MFM) which weights intra-bar volume for smoother results. An optional Exponential Moving Average (EMA) smoothing can be applied to Delta to highlight regime changes.
Outputs include separate histograms for positive and negative Delta, the CVD line, an optional Delta EMA line, and a zero baseline for reference. Traders can use the indicator to confirm breakouts, identify divergences between price and volume flow, and assess order-flow pressure. It works on any symbol and timeframe, supporting markets such as Forex, indices, commodities, stocks, and cryptocurrencies.


