
Descrição
Indicador de Rompimento de Volatilidade - Motor de Volatilidade Hawkes
Este indicador destina-se a fornecer contexto, não ações imediatas de negociação. O componente de volatilidade ajuda você a saber quando as condições do mercado estão mudando - períodos de baixa volatilidade frequentemente precedem grandes movimentos, e períodos de alta volatilidade eventualmente se esgotam. O componente EWMA mantém você orientado com a tendência em desenvolvimento e destaca quando o preço se afasta dela.
Combine essas duas perspectivas - regime de volatilidade e contexto de tendência - com sua própria metodologia e julgamento de negociação. O indicador mostra o ambiente - você decide o que fazer nele.
Versão 2.0
Aberto para futuras atualizações
-----------------------------------------------------------------------------------------------------------------------------------------------------------------------
Visão Geral
-----------------------------------------------------------------------------------------------------------------------------------------------------------------------
Este indicador combina dois componentes distintos para ajudar os traders a identificar regimes de volatilidade e condições de tendência simultaneamente.
O primeiro componente usa um Processo Hawkes para detectar mudanças na volatilidade do mercado. Ao contrário dos indicadores tradicionais de volatilidade, ele não prevê a direção—simplesmente sinaliza quando o mercado está transitando de compressão silenciosa para volatilidade ativa, ou vice-versa. Pense nele como um detector de estado de volatilidade: ele informa quando as coisas estão esquentando ou esfriando, mas não para qual lado o preço vai se mover.
O segundo componente adiciona um sistema duplo de EWMA (Média Móvel Exponencialmente Ponderada) que se sobrepõe ao seu gráfico de preços. Isso fornece contexto de tendência usando um cruzamento de médias móveis rápida e lenta, com uma camada adicional de coloração das velas para mostrar quando o preço diverge da tendência.
-----------------------------------------------------------------------------------------------------------------------------------------------------------------------
Como funciona
-----------------------------------------------------------------------------------------------------------------------------------------------------------------------
Detecção de Volatilidade: O indicador usa o estimador de Volatilidade Alta-Baixa de Parkinson—um método mais eficiente que o ATR padrão porque utiliza toda a faixa da barra. Essa volatilidade normalizada alimenta um cálculo do Processo Hawkes, que é então comparado com limites dinâmicos baseados em quantis.
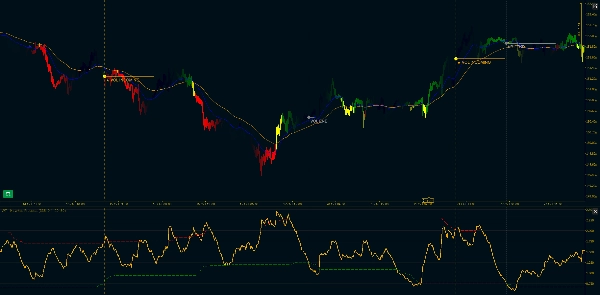
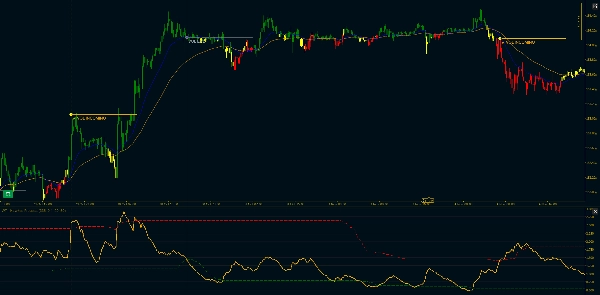
Quando a volatilidade ultrapassa o limite superior após um período de compressão, você recebe um sinal "VOL INCOMING". Quando cai novamente abaixo do limite inferior, aparece "VOL END". Estes não são sinais de entrada—são mudanças no regime de volatilidade. O mercado está acordando ou indo dormir.
Contexto de Tendência: Duas médias móveis exponencialmente ponderadas (Rápida e Lenta) aparecem no seu gráfico principal. A MA Rápida é azul, a MA Lenta é laranja. Quando a Rápida está acima da Lenta, a tendência é de alta. Quando a Rápida está abaixo da Lenta, a tendência é de baixa.
O Filtro de Divergência: Aqui é onde fica interessante. Às vezes o preço se afasta significativamente da tendência. Quando toda a vela (abertura, máxima, mínima, fechamento) está abaixo da MA Rápida durante uma tendência de alta, ou acima dela durante uma tendência de baixa, a barra fica amarela. Este é um filtro rigoroso—se mesmo o pavio tocar a MA Rápida, ela mantém a cor normal da tendência.
Barras amarelas frequentemente aparecem em retrações ou pontos de exaustão, mas lembre-se: elas não indicam o que vem a seguir, apenas que o preço se separou temporariamente da linha de tendência.
-----------------------------------------------------------------------------------------------------------------------------------------------------------------------
Principais Características
-----------------------------------------------------------------------------------------------------------------------------------------------------------------------
Componente de Volatilidade:
- Normalização de Volatilidade Alta-Baixa de Parkinson (mais eficiente que o método ATR padrão)
- Cálculo do Processo Hawkes com decaimento ajustável (parâmetro Kappa)
- Limites dinâmicos baseados em quantis (percentis personalizáveis)
- Marcadores visuais: "VOL INCOMING" em rompimentos de volatilidade, "VOL END" em compressões
- Filtragem de continuação: apenas o primeiro rompimento é marcado, não cada pico
- Linhas de tendência horizontais opcionais e marcadores verticais
Componente de Tendência EWMA:
- Cálculo EWMA compatível com Pandas (fórmula adjust=True)
- Linhas MA Rápida e Lenta exibidas no gráfico principal de preços
- Comprimentos de span personalizáveis (padrão: 20/50)
- Suporte a períodos mínimos (suprime saída até dados suficientes)
- Opção Ignorar NA para lidar com lacunas
- Sistema de velas com três cores: Verde (tendência de alta), Vermelho (tendência de baixa), Amarelo (divergência)
Opções de Personalização:
- Período de Parkinson (retrocesso para cálculo de volatilidade)
- Kappa de Hawkes (taxa de decaimento, afeta sensibilidade)
- Período de Retrocesso do Quantil
- Limites de Volatilidade Baixa e Alta (percentis)
- Alternância de anualização e comprimento do segmento
- Span Rápido e Lento para médias móveis
- Cores para alta, baixa e divergência
- Comprimento de extensão da linha de tendência
- Mostrar/ocultar marcadores verticais
----------------------------------------------------------------------------------------------------------------------------------------------------------------------------
Nota Técnica: O componente do Processo Hawkes usa um cálculo exponencial recursivo otimizado para uso em tempo real. A implementação do EWMA corresponde ao comportamento do Pandas para consistência com backtesting baseado em Python. Ambos os componentes calculam apenas em barras fechadas para evitar repintura.
Resumo
Avaliações de clientes
5 | 100 % | |
4 | 0 % | |
3 | 0 % | |
2 | 0 % | |
1 | 0 % |


