
Descrição
Descubra Zonas de Negociação de Alta Probabilidade com Advanced Supply Demand!
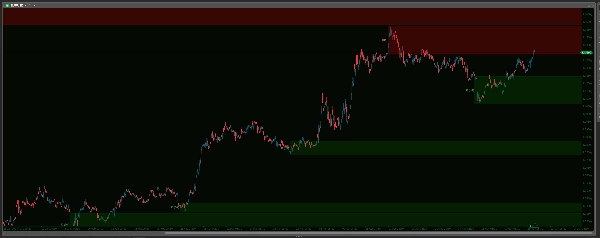
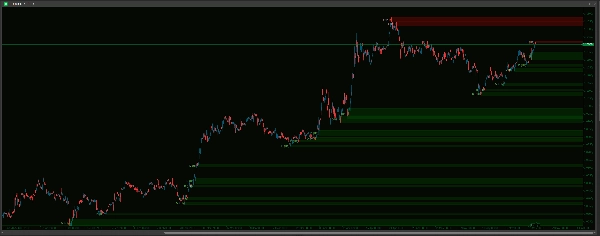
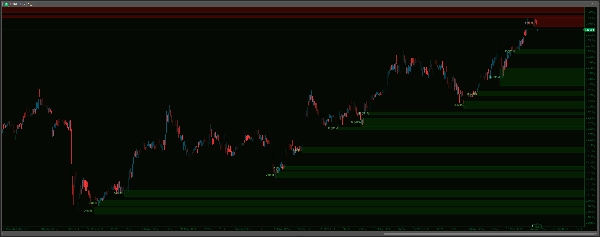
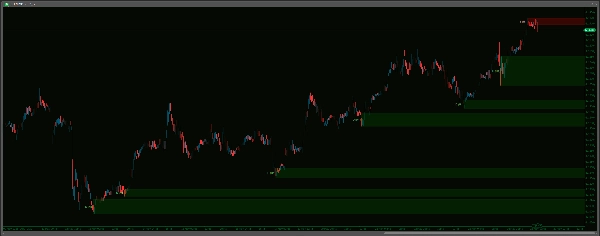
Desbloqueie uma visão mais clara do mercado com o indicador Advanced Supply Demand Zones V2 . Esta poderosa ferramenta identifica e destaca automaticamente áreas cruciais de oferta e demanda no seu gráfico, potencialmente apontando onde podem ocorrer reações significativas de preço. Apresentando um sofisticado algoritmo de detecção de pontos de oscilação, capacidades multi-temporais (MTF) e amplas opções de personalização, você pode ajustar o indicador perfeitamente ao seu estilo de negociação. Gerencie as zonas de forma eficaz com opções para remover áreas quebradas ou coincidentes, aplicar limites de tempo e manter seu gráfico limpo. Melhore sua análise com aparências de zona personalizáveis, etiquetas claras de timeframe e um robusto sistema de alerta sonoro – completo com um buffer de dados ao vivo para evitar ruído histórico – garantindo que você seja notificado sobre aproximações importantes de preço às suas zonas definidas. Leve sua análise técnica para o próximo nível e tome decisões de negociação mais informadas!
-------------------
Melhorias em relação à V1:
Advanced Supply Demand V2 oferece melhorias significativas para uma experiência de negociação mais precisa, amigável e eficaz:
- Alertas Mais Inteligentes e Silenciosos – Chega de Ruído Histórico!
-
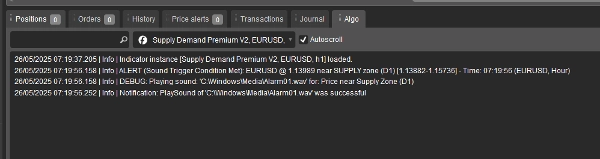
- Os alertas disparam com a ação de preço em tempo real após o carregamento, eliminando alertas históricos irritantes! Além disso, escolha seus sons a partir de um menu suspenso fácil, um grande avanço em relação a digitar nomes de arquivos. Você também tem Máximo de Alertas por Zona para evitar spam de notificações.
- Configuração Sem Esforço – Configurações Simplificadas!
-
- Desfrute de uma configuração muito mais intuitiva com menus suspensos para a maioria das opções (Timeframes, escolhas Sim/Não, Estilos de Linha, Arquivos de Som). Acertar na primeira vez, sempre!
- Lógica e Gestão de Zonas Mais Claras – Menos Confusão, Mais Clareza!
-
- Simplificado para uma abordagem mais direta e acionável. A V2 usa regras claras para remover zonas quebradas, gerencia inteligentemente zonas sobrepostas (coincidentes) para manter seu gráfico organizado, e oferece um simples expiração baseada em tempo para zonas antigas, além de uma opção para limitar o número de zonas exibidas.
- Controle Visual Superior – Seu Gráfico, Do Seu Jeito!
-
- Obtenha controle granular com configurações de aparência separadas (Cor, Espessura, Estilo) para zonas de Oferta e Demanda. Ajuste os visuais precisamente ao seu gosto e torne as zonas interativas no seu gráfico!
- Definição de Zona Mais Flexível!
-
- Agora inclui a opção
IncludeBarBody, permitindo escolher entre zonas apenas com pavios ou zonas que incorporam o corpo da vela para uma perspectiva de mercado potencialmente mais ampla e diferente.
- Agora inclui a opção
-------------------
Guia de Configurações: Advanced Supply Demand Zones
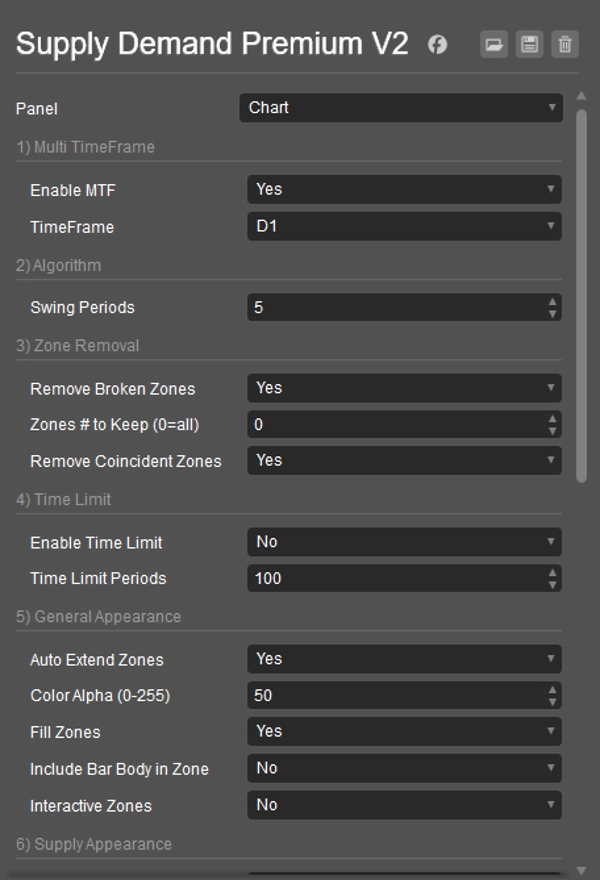
1) Multi TimeFrame
- Ativar MTF: Sim para ver zonas de um timeframe diferente no seu gráfico atual. Não para zonas do gráfico atual.
- TimeFrame: Se MTF for Sim, escolha o outro timeframe aqui (ex.: zonas H4 em um gráfico M15).
2) Algoritmo
- Períodos de Oscilação: Define quantas barras definem uma forte reversão de mercado (ponto de oscilação) para criar zonas. Números maiores significam zonas mais fortes (e geralmente menos).
3) Remoção de Zona
- Remover Zonas Quebradas: Sim para deletar automaticamente zonas uma vez que o preço as ultrapasse claramente.
- Número de Zonas para Manter (0=todas): Limita quantas das zonas mais recentes são exibidas.
0mostra todas. - Remover Zonas Coincidentes: Sim para remover automaticamente a zona mais antiga se duas zonas se sobrepuserem fortemente, mantendo o gráfico mais limpo.
4) Limite de Tempo
- Ativar Limite de Tempo: Sim para fazer zonas muito antigas desaparecerem automaticamente.
- Períodos do Limite de Tempo: Se o limite de tempo estiver ativado, zonas mais antigas que este número de barras serão removidas.
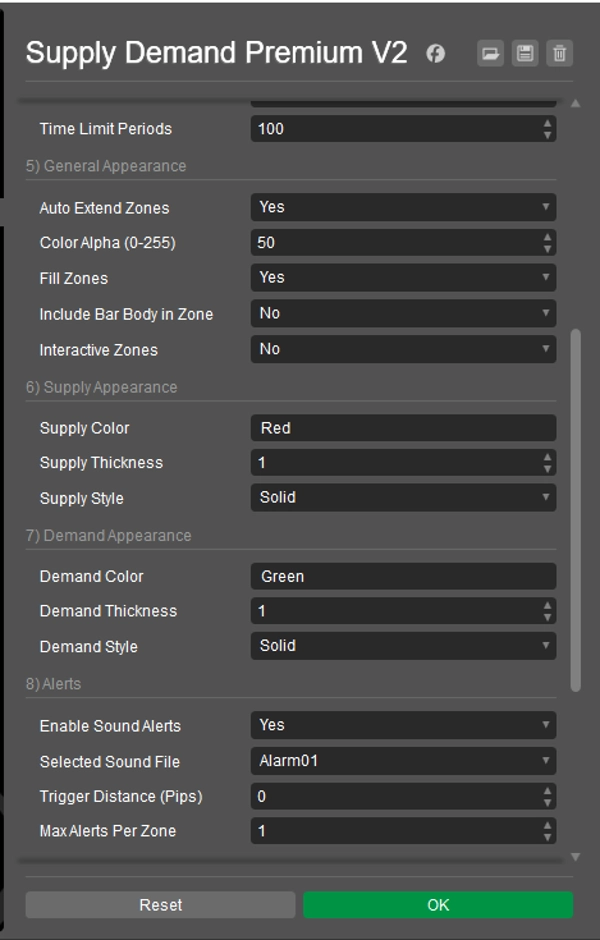
5) Aparência Geral
- Auto Estender Zonas: Sim para desenhar zonas longe no futuro. Não para zonas mais curtas.
- Cor Alfa (0-255): Define o quão transparente as cores das zonas são (0 = invisível, 255 = sólido).
- Preencher Zonas: Sim para preencher as zonas com cor. Não para apenas contornos.
- Incluir Corpo da Barra na Zona: Sim para usar o corpo da vela (mais pavios) para a largura da zona. Não para usar apenas os pavios.
- Zonas Interativas: Sim para permitir que você clique e mova zonas no gráfico.
6) Aparência da Oferta
- Cor da Oferta: Define a cor para zonas de oferta (superiores). (ex.: "Vermelho", "#FF0000")
- Espessura da Oferta: Define a espessura da linha da borda para zonas de oferta.
- Estilo da Oferta: Define o estilo da linha da borda (Sólido, Pontos, etc.) para zonas de oferta.
7) Aparência da Demanda
- Cor da Demanda: Define a cor para zonas de demanda (inferiores). (ex.: "Verde", "#00FF00")
- Espessura da Demanda: Define a espessura da linha da borda para zonas de demanda.
- Estilo da Demanda: Define o estilo da linha da borda (Sólido, Pontos, etc.) para zonas de demanda.
8) Alertas Nota: Para evitar alertas em dados antigos ou logo na inicialização, os alertas sonoros só serão ativados após 20 ticks de preço ao vivo desde que o indicador foi carregado no seu gráfico.
- Ativar Alertas Sonoros: Sim para ligar notificações sonoras quando o preço se aproxima de uma zona.
- Arquivo de Som Selecionado: Escolha o som que deseja ouvir para os alertas. Sons do sistema (como "Alarm01") tentam tocar de
C:\Windows\Media\; certifique-se de que o arquivo existe e que o cTrader pode acessá-lo. "cTraderDefaultAlert" usa um som padrão do cTrader. "Nenhum" não toca som. - Distância de Disparo (Pips): Quão perto (em pips) o preço deve chegar da borda de uma zona para disparar um alerta.
- Máximo de Alertas por Zona: Limita quantas vezes um alerta soará para a mesma zona.
9) Etiqueta de TimeFrame
- Mostrar Etiqueta de Timeframe: Sim para exibir o timeframe (ex.: H1, D1) em cada zona.
- Cor da Etiqueta de Oferta: Cor do texto para etiquetas de zonas de oferta.
- Cor da Etiqueta de Demanda: Cor do texto para etiquetas de zonas de demanda.
- Deslocamento X da Etiqueta (Barras): Ajusta a posição horizontal da etiqueta a partir do início da zona.
- Tamanho da Fonte da Etiqueta: Define o tamanho do texto da etiqueta.
10) Outros
- Limpeza na Inicialização: Sim para remover desenhos antigos deste indicador quando o cTrader iniciar ou o indicador for adicionado a um gráfico.
- Reidentificar Zonas Removidas: (Esta configuração tem impacto direto limitado na versão atual. As zonas são reavaliadas a cada tick; se os critérios para uma zona forem atendidos novamente e ela não for considerada quebrada, reaparecerá independentemente desta configuração estar em Sim ou Não).
----------------------------
Sinta-se à vontade para conferir meus outros indicadores:
https://ctrader.com/products/1181
https://ctrader.com/products/1182
https://ctrader.com/products/1180
https://ctrader.com/products/1015
https://ctrader.com/products/555
https://ctrader.com/products/553
https://ctrader.com/products/554
https://ctrader.com/products/552
https://ctrader.com/products/557
https://ctrader.com/products/845
https://ctrader.com/products/848
https://ctrader.com/products/847
https://ctrader.com/products/846
https://ctrader.com/products/551
https://ctrader.com/products/574
https://ctrader.com/products/573
https://ctrader.com/products/556
https://ctrader.com/products/558
https://ctrader.com/products/559
https://ctrader.com/products/560
Resumo
Visual customization is granular, with separate settings for supply and demand zone colors, thickness, and line styles. Zones can be configured to include candle wicks only or both wicks and bodies, providing flexible market perspectives. Interactive zones allow users to click and move zones directly on the chart.
The alert system is designed to minimize noise by triggering notifications only on live price action after the indicator loads, with configurable sound options and limits on alert frequency per zone. Timeframe labels can be displayed on zones with customizable appearance settings.
Additional features include automatic cleanup of old drawings on startup and options to re-identify zones dynamically. This indicator aims to enhance technical analysis by clearly marking high-probability trading zones for more informed decision-making.
Avaliações de clientes
5 | 0 % | |
4 | 100 % | |
3 | 0 % | |
2 | 0 % | |
1 | 0 % |


