Descrição
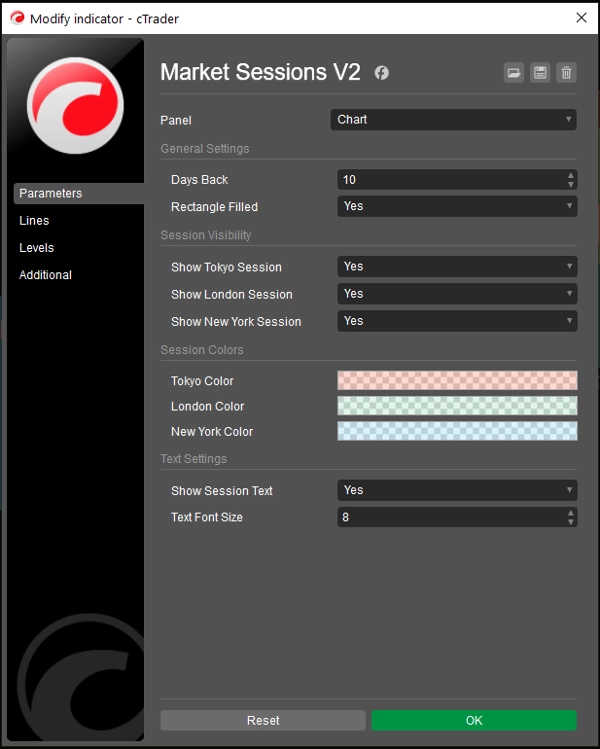
Market Session v2!
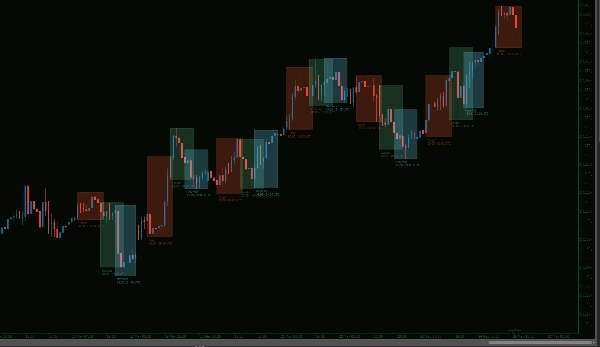
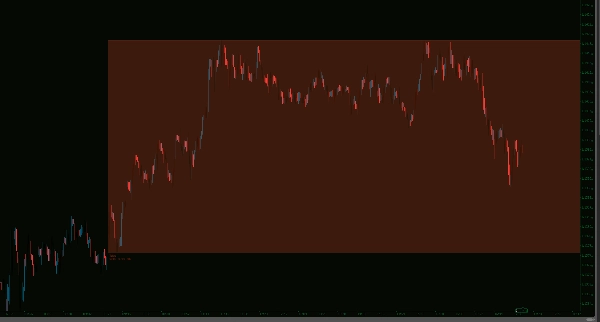
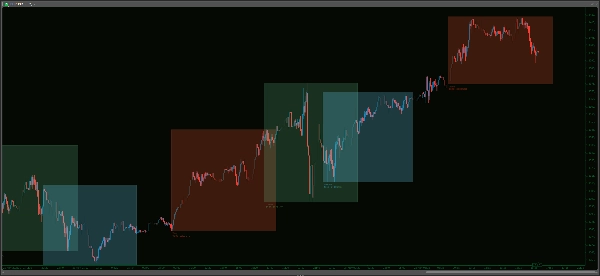
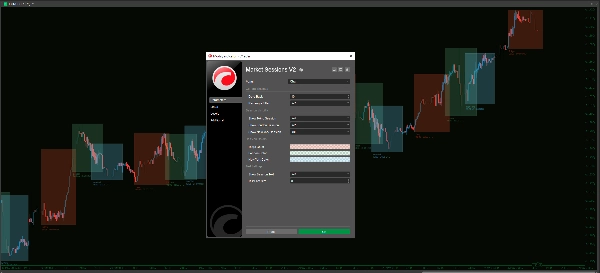
Desbloqueie insights cruciais do mercado com o Indicador Market Sessions V2! Visualize claramente as sessões de negociação de Tóquio, Londres e Nova York diretamente em seus gráficos, completas com retângulos dinâmicos de máxima/mínima. Personalize a exibição conforme suas preferências exatas com cores personalizáveis, retângulos preenchidos e controle sobre o número de dias históricos exibidos. Aperfeiçoe sua análise ativando ou desativando sessões individuais e ajuste a visibilidade do texto da sessão e o tamanho da fonte para uma visualização perfeitamente clara. Este indicador é uma ferramenta essencial para qualquer trader de forex que deseja identificar janelas de negociação chave, sobreposições de sessões e potenciais pontos de volatilidade para aprimorar sua estratégia.
------------------------
Sinta-se à vontade para conferir meus outros indicadores:
https://ctrader.com/products/1181
https://ctrader.com/products/1182
https://ctrader.com/products/1180
https://ctrader.com/products/1015
https://ctrader.com/products/555
https://ctrader.com/products/553
https://ctrader.com/products/554
https://ctrader.com/products/552
https://ctrader.com/products/557
https://ctrader.com/products/845
https://ctrader.com/products/848
https://ctrader.com/products/847
https://ctrader.com/products/846
https://ctrader.com/products/551
https://ctrader.com/products/574
https://ctrader.com/products/573
https://ctrader.com/products/556
https://ctrader.com/products/558
https://ctrader.com/products/559
https://ctrader.com/products/560
Resumo
Avaliações de clientes
5 | 100 % | |
4 | 0 % | |
3 | 0 % | |
2 | 0 % | |
1 | 0 % |