
Market Structure SNR + Auto Bias
インジケーター
7 購入済
バージョン 2.1、Nov 2025
Windows、Mac
4.3
レビュー: 3
説明
平均足構造バイアス(cTraderインジケーター)
マルチタイムフレームバイアスを持つ自動供給・需要ゾーン。
何をするか – わかりやすく説明すると
このインジケーターは自動的に:
- 平均足の価格動向を読み取り、重要なピボットの変化を検出します。
- これらのピボットの周りに動的なサポートおよびレジスタンスゾーンを構築し、ヒゲの極値とローソク足の実体の両方を使用します(単なるランダムな線ではありません)。
- 近接するゾーンを賢く統合し、水平線の森ではなく、きれいで取引可能なレベルを表示します。
- 価格が最新のサポートまたはレジスタンスゾーンを完全に突破したときに、明確な強気または弱気のバイアスを生成します。
- 以下のバイアスを表示します:
-
- あなたの チャートの時間枠、および
- オプションの 上位時間枠(デフォルトはH2) — チャート上にHTFの乱雑さを描画せずに。
結果:一目で 本当のレベルがどこにあるか、そして市場が現在 上昇傾向か下降傾向かを知ることができます。
解決する問題
ほとんどのトレーダーは同じ問題を抱えています:
- 手描きのサポート/レジスタンスラインは:
-
- 主観的で、
- 一貫性がなく、
- しばしば過剰に描かれています。
- 単純な「ジグザグ+水平線」インジケーターは:
-
- ゾーン幅を適切に処理せず、
- レベルが重なり合い、
- ゾーンをチャートの半分まで伸ばしてしまいます。
- バイアスはしばしば「頭の中にある」もので、明確に見えたりルールベースで使えたりしません。
このインジケーターは以下のために作られています:
- 平均足構造を 明確で客観的なゾーンに変換し、
- それらのゾーンに基づく ルールベースのトレンド/バイアスを提供し、
- チャートを きれいで読みやすく保ちます。
ゾーンの構築方法(トレーダー向けの説明)
各平均足ピボットに対して、インジケーターは 3本のローソク足構造を見ます:
- HAが 赤から緑に変わるとき、サポートのピボットを示します。
- HAが 緑から赤に変わるとき、レジスタンスのピボットを示します。
次にゾーンを構築します:
サポートゾーン
- 3本のローソク足の中で 最も低いヒゲ(真の極値)を見つけます。
- その極値よりまだ高い 次に低い安値を見つけます。
- その内側の安値付近の ローソク足の実体(始値/終値)を使って、ゾーンの「取引可能な」側面を定義します。
- 最終的なサポートゾーン:
-
- 下限=極端なヒゲの安値、
- 上限=実体に基づく内側のレベル。
レジスタンスゾーン
- 3本のローソク足の中で 最も高いヒゲを見つけます。
- その極値よりまだ低い 次に高い高値を見つけます。
- その内側の高値付近の実体を使います。
- 最終的なレジスタンスゾーン:
-
- 上限=極端なヒゲの高値、
- 下限=実体に基づく内側のレベル。
つまり、各ゾーンは単なる任意の帯域ではなく:
価格が実際に拒否または反転した場所を表す ヒゲから実体への範囲です。
統合ロジック(チャートがきれいに保たれる理由)
同じタイプのゾーン(サポート同士、レジスタンス同士)は:
- タイムライン上の ユニットとして扱われます。
- 価格が 実際に重なっている場合にのみ統合できます。
- 統合は厳密に 局所的です:
-
- 新しいゾーンは以下と統合できます:
-
- 最新のゾーン(連続)、または
- 2番目に新しいゾーン(1つ空けて)、そして
- 新しい統合ゾーンが以前の構造と重なる場合、さらに1つの「アンカー」統合が可能です。
これにより動作が直感的になります:
- ゾーンは履歴全体を「飲み込む」ことはありません。
- 古いレベルは尊重されますが、巨大なメガゾーンを作ることは許されません。
- A–B–CやA–C+Dのような局所構造は制御された方法で処理されます。
バイアスロジック(実際の取引方法)
各時間枠(メインとHTF)について:
- インジケーターは 最新の統合サポートゾーンと 最新の統合レジスタンスゾーンを追跡します。
- そして、各クローズしたローソク足で:
-
- 価格が 最新のレジスタンスゾーンの上で終値をつけた場合→ バイアスは 強気になります。
- 価格が 最新のサポートゾーンの下で終値をつけた場合→ バイアスは 弱気になります。
以下を保存します:
- 最後のバイアス反転の 時間、
- 価格がゾーンを突破した 価格レベル。
チャート上には小さなテキストパネルが表示されます:
Main (H1) バイアス: 強気Main (H1) シフト: 11/26 15:00 @1.08750
HTFが有効な場合、以下のような表示もあります:
HTF (H2) バイアス: 弱気HTF (H2) シフト: 11/25 08:00 @1.09200
メイン時間枠のバイアスが反転したときに サウンドアラートを有効にすることもできます。
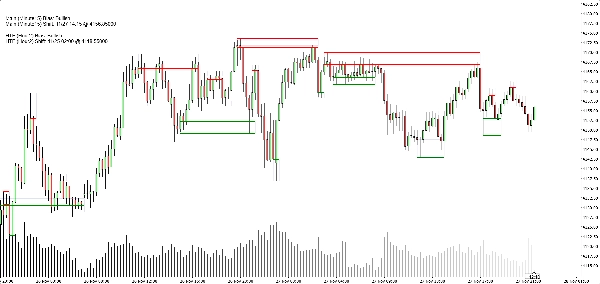
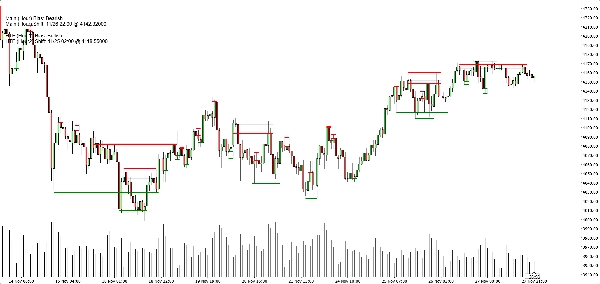
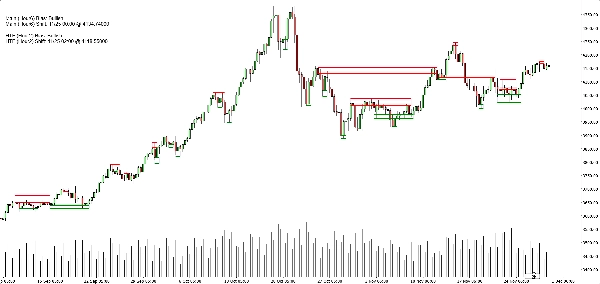
チャート上で見えるもの
- サポートゾーン:
-
- 緑の水平ベース/トリガーライン(オプション)、
- 非常に低い不透明度の ソフトネイビーの長方形で完全なサポートバンドを表示。
- レジスタンスゾーン:
-
- 赤い線+バンド用のソフトネイビーの長方形。
- きれいな表示切替:
-
- サポートゾーンの表示/非表示、
- レジスタンスゾーンの表示/非表示、
- 塗りつぶし長方形のオン/オフ、
- ベース/トリガーラインのオン/オフ、
- バイアスパネルのオン/オフ。
これにより、異なるトレーダーが以下のどちらかを選択できます:
- より ミニマリストな見た目(おそらく長方形だけ)、または
- より 正確なビュー(正確な線が見える)。
典型的な使用例
以下の用途に役立てることができます:
- トレンドフィルタリング
-
- メインTFとHTFの両方のバイアスが強気のときだけ買いを狙う。
- 両方が弱気のときだけ売りを狙う。
- ゾーンエントリー
-
- ゾーンを 注目エリアとして使用:
-
- 指値注文、
- 確認エントリー(例:価格が破られたゾーンに戻り再び拒否)、
- 外側バンドのすぐ外にストップを置く。
- トップダウン分析
-
- HTFバイアス(デフォルトはH2)を大局として、
- チャートTFバイアスでタイミングを取り、
- ゾーンで具体的な実行レベルを確認。
これではないもの(正直な販売のために重要)
- これは 自動取引ロボットではありません。
- これは 利益を保証する「聖杯」シグナルではありません。
- これは 構造とバイアスのエンジンです:
-
- ゾーンを客観的に定義し、
- それらのゾーンに基づくトレンド/バイアスを客観的に定義し、
- 実際の取引管理はトレーダーや戦略に任せます。
概要
AIによる概要
Market Structure SNR + Auto Bias is a trading indicator designed to identify and visualize key market structure elements using Heikin Ashi price action. It automatically detects meaningful pivot points where price momentum shifts, then constructs dynamic support and resistance zones based on the wick extremes and candle bodies of these pivots. The indicator intelligently merges overlapping zones to present clear, tradable levels without cluttering the chart.
It provides a rule-based bullish or bearish bias by tracking price breaks above resistance or below support zones on both the current chart timeframe and an optional higher timeframe. This bias is displayed on a built-in dashboard panel, with optional sound alerts for bias changes.
The indicator works across all timeframes and markets where price forms swings, including forex, crypto, stocks, and futures. It features customizable lookback periods, automatic cleanup of old zones, and toggles for display elements to suit different trader preferences.
Typical uses include trend filtering by aligning biases across timeframes, identifying zone entries for limit or confirmation orders, and supporting top-down analysis. The tool timestamps and sequences pivots and bias shifts, facilitating automation or journaling. It is a structure and bias engine that aids traders in objectively defining market levels and trends while maintaining chart clarity.
インジケーターのプロフィール
カスタマーレビュー
4.3
レビュー: 3
5 | 33 % | |
4 | 67 % | |
3 | 0 % | |
2 | 0 % | |
1 | 0 % |
カスタマーレビュー
May 25, 2025
Clean market assistant if the trader wants it makes market context easier to scan. It works best as support, not a final decision maker. I would test it on 2 timeframes, 20 signals and a 1R stop plan. it should not be used as a blind entry trigger.
May 24, 2025
May 24, 2025
Useful pick for demo for traders who combine signals before acting. It gives value around chart reading, but it should not be used as a blind entry trigger. The cleaner reads should hold across 3 sessions, not just 1 good chart. It is stronger when a 1.5R target is realistic before the entry.
ディスカッション
よくあるご質問
Forex
Scalping
Crypto
Stocks
cTrader Storeで入手可能な取引ボット、インジケーター、プラグインなどの商品は、第三者の開発者が提供するものであり、情報と技術の取得のみを目的としてご利用いただけます。cTrader Storeはブローカーではなく、投資助言や個人的な推奨を行うことも、将来のパフォーマンスを保証することもありません。
この作成者の他の商品

これも好きかも


価格
登録日 25/03/2025
181.08M
取引数量
2.17M
獲得pips
21
販売