
说明
cTrader 的 FZ 指标
描述
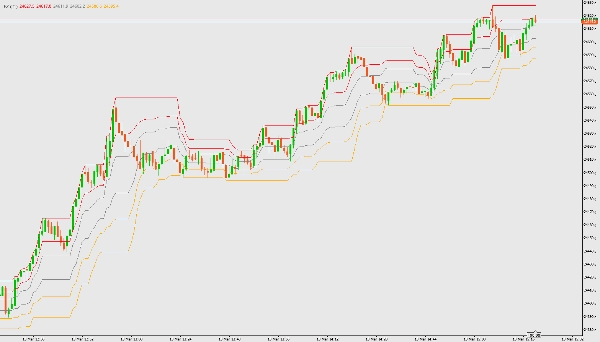
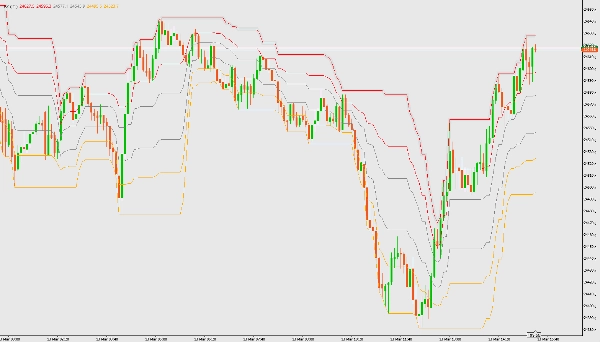
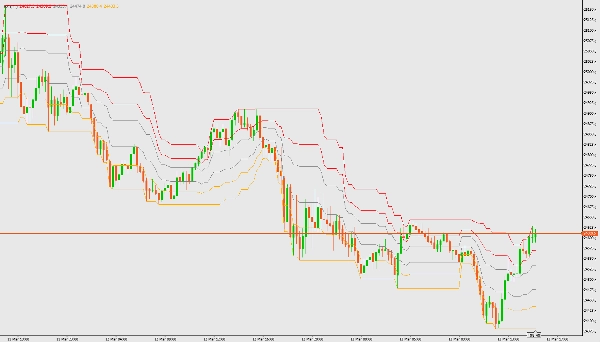
FZ 指标根据用户定义周期内的最高价和最低价绘制斐波那契通道区域。它有助于识别趋势区域和潜在的反转区域。
功能
参数
- 计算最近 ## 根柱:用于计算的柱数(默认值:21)
使用方法
- 下载并将 FZ 指标文件(FZ.cs)添加到您的 cTrader 平台。
- 在 cTrader Automate 中编译该指标。
- 将指标附加到任意图表。
- 根据需要调整柱数参数。
- 解读彩色区域:
-
- 青色:上升趋势区域(做多)
- 灰色:盘整区域(等待趋势变化)
- 橙色:下降趋势区域(做空)
摘要
指标配置
客户评价
4.0
评价:2
5 | 0 % | |
4 | 100 % | |
3 | 0 % | |
2 | 0 % | |
1 | 0 % |
讨论
常见问答
BTCUSD
Forex
Signal
Breakout
Indices
EURUSD
Commodities
GBPUSD
NZDUSD
Prop
Scalping
Crypto
Grid
Stocks
AI
XAUUSD
NAS100
USDJPY
cTrader Store 提供的所有产品,包括交易机器人、指标和插件,均由第三方开发者提供,仅供信息参考和技术访问之用。cTrader Store 并非经纪商,不提供投资建议、个人推荐或任何未来业绩保证。
该作者的其他作品


价格
注册日期 10/03/2026
105
免费安装