
说明
利用这个电力十足的指标主导市场,该指标使用动态移动平均线识别趋势反转,释放大胆的“Sabre”形态作为支撑、阻力或突破区域。通过可自定义的设置和锐利的警报,它是您交易成功的秘密武器!
配置
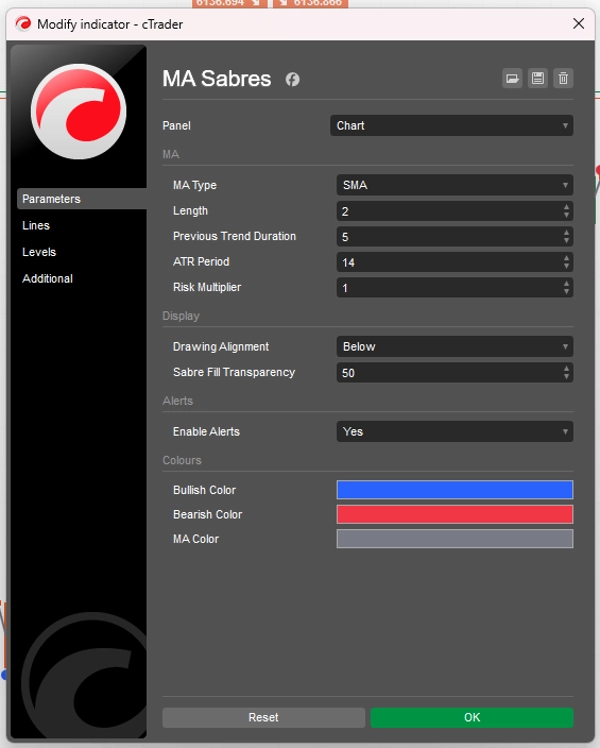
- MA 类型:从下拉菜单中选择您的移动平均线(SMA、EMA、SMMA_RMA、HullMA、WMA、VWMA、DEMA、TEMA,选择 NONE 可禁用)。默认是 TEMA,以获得快速信号。
-
- 长度:设置 MA 和 Sabre 的长度(默认:50,最小:1)以控制其范围。
- 前期趋势持续时间:定义 MA 必须趋势的柱数(默认:20,最小:1),然后反转触发 Sabre。
- ATR 周期:调整平均真实波幅周期(默认:14,最小:1),以根据市场波动性确定 Sabre 的位置。
- 风险倍数:放大或缩小 Sabre 与价格的距离(默认:1.0,范围:0.1–5.0),以获得更大胆或更紧密的信号。
- 绘图对齐:将 Sabre 和圆圈定位在上方、下方或居中(默认:居中),以避免图表混乱。
- Sabre 填充透明度:调整填充不透明度(默认:50,范围:0–100),以获得清晰视图。
- 启用警报:切换开关(默认:false)以接收声音警报。
使用方法
- 识别反转点:
-
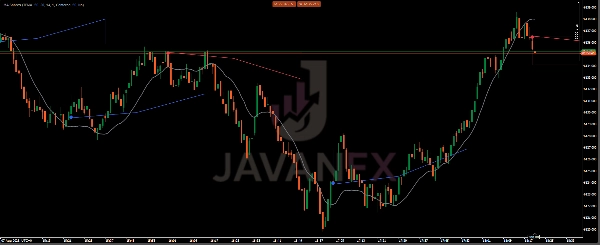
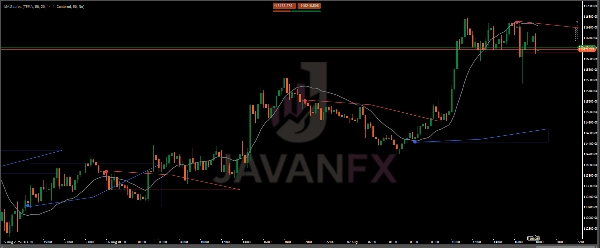
- 当 MA 在稳定趋势后发生变化时,寻找 Sabre(四条趋势线带填充底部)和圆圈(三层图标)。
- 向上的 Sabre 配蓝色圆圈表示看涨上涨;向下的 Sabre 配红色圆圈表示看跌下跌。
- 调整设置:
-
- 缩短长度(例如 20)和前期趋势持续时间(例如 10),以适应震荡市场的快速变动。
- 提高风险倍数(例如 2.0)以在趋势中获得更宽的 Sabre,或降低(例如 0.5)以在区间中获得更精确的信号。
- 如果蜡烛遮挡视线,可将对齐方式调整为上方或下方。
- 利用警报:
-
- 开启启用警报以获得实时图表通知。
- 交易策略:
-
- 入场:在向上的 Sabre/圆圈处做多,或在向下的处做空。
- 出场:以 MA 趋势线作为止损,或在相反的 Sabre 信号处退出。
- 验证:结合 UT Bot Alert、RSI 或布林带等工具,确保设置稳固。
摘要
指标配置
客户评价
4.5
评价:2
5 | 50 % | |
4 | 50 % | |
3 | 0 % | |
2 | 0 % | |
1 | 0 % |
客户评价
October 10, 2025
Smooth and clean ⚡ MA Sabres cuts through noise like blades — great trend clarity, fast updates, and zero lag. Perfect base for MA-based systems!
August 14, 2025
Demo first, then maybe small size if the notes look sane. Account protection still comes first.
讨论
常见问答
cTrader Store 提供的所有产品,包括交易机器人、指标和插件,均由第三方开发者提供,仅供信息参考和技术访问之用。cTrader Store 并非经纪商,不提供投资建议、个人推荐或任何未来业绩保证。


价格
注册日期 14/07/2025
60
销售