
Mô tả
chỉ báo >màu nến theo thời gian thực dựa trên cấu trúc thị trường và vẽ các vùng thanh khoản, dòng chảy tổ chức và phạm vi hợp nhất. Được thiết kế cho các nhà giao dịch hoạt động theo Nguyên tắc Smart Money Concepts (SMC) .
🧠 Logic Thuật toán
https://chartshots.spotware.com/c/69f0e3fd81319
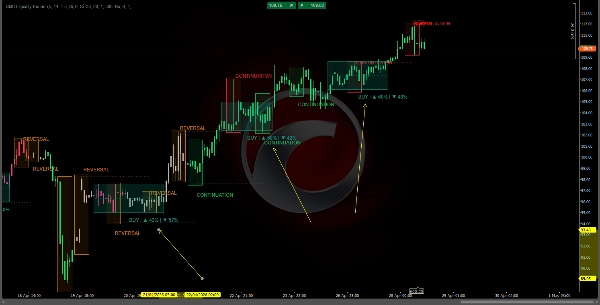
1. Phát hiện cấu trúc thị trường 🔍
- Tìm các điểm xoay (đỉnh và đáy cục bộ) sử dụng khoảng thời gian nhìn lại có thể cấu hình.
- So sánh các điểm xoay liên tiếp để xác định cấu trúc:
-
- Đỉnh cao hơn + Đáy cao hơn = Xu hướng tăng 📈
- Đỉnh thấp hơn + Đáy thấp hơn = Xu hướng giảm 📉
- Tín hiệu hỗn hợp = Trung lập ➡️
- Lọc nhiễu: chỉ đếm các điểm xoay vượt qua ngưỡng dựa trên ATR (Average True Range) nhân với độ nhạy có thể điều chỉnh.
https://chartshots.spotware.com/c/69f0e7e752b74
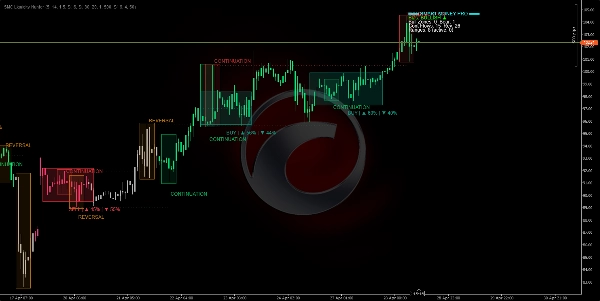
2. Dòng chảy tổ chức (Hộp dòng chảy) 🔄
- Mỗi khi một điểm xoay quan trọng mới hình thành, thuật toán vẽ một đường ngang từ điểm xoay trước đến điểm mới.
- Phân loại dòng chảy như:
-
- Tiếp diễn: giá tôn trọng xu hướng (HL trong xu hướng tăng, LH trong xu hướng giảm) ✅
- Đảo chiều: giá phá vỡ cấu trúc (LL trong xu hướng tăng, HH trong xu hướng giảm) ⚠️
- Vẽ một hộp màu xung quanh điểm xoay được gắn nhãn "TIẾP DIỄN" hoặc "ĐẢO CHIỀU".
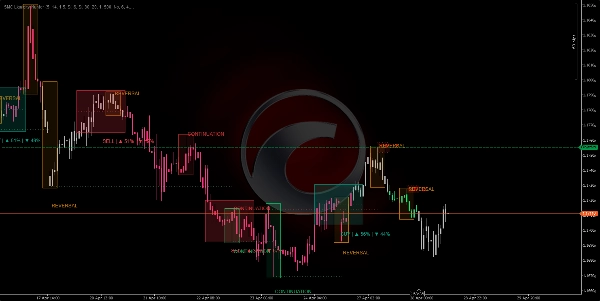
3. Vùng cung/cầu (Thanh khoản) 💧
https://chartshots.spotware.com/c/69f0e8e7aef29
- Xung quanh mỗi điểm xoay quan trọng, một dải ngang được vẽ kéo dài về phía trước trong một số thanh có thể cấu hình.
- Những vùng này đại diện cho lệnh tổ chức chưa thực hiện:
-
- Điểm xoay giảm → vùng CUNG (lệnh bán) 🔴
- Điểm xoay tăng → vùng CẦU (lệnh mua) 🟢
- Một vùng bị phá vỡ và biến mất khi giá xuyên thủng nó với lực đủ mạnh hoặc khi thời gian tồn tại của nó hết hạn.
4. Bộ phát hiện phạm vi (Hợp nhất) 📦
- Tính toán một Trung bình Động Đơn giản (SMA) với một dải ATR xung quanh nó.
- Nếu mọi thanh trong cửa sổ nhìn lại nằm trong dải, thuật toán xác định một phạm vi hợp nhất.
- Vẽ một hình chữ nhật màu xanh với:
-
- Đường giữa chấm chấm (cân bằng phạm vi) ⚖️
- Tỷ lệ xác suất phá vỡ tăng/giảm dựa trên:
-
- Động lượng định hướng (ADX/DI+ so với DI-) 📐
- Khối lượng tích lũy tăng so với giảm trong phạm vi 📊
- Thời gian ở nửa trên so với nửa dưới ⏱️
5. Tô màu nến (Sạch & Trực quan) 🕯️
- Nến xanh lá = cấu trúc tăng được xác nhận (HH+HL) 🟢
- Nến hồng/đỏ = cấu trúc giảm được xác nhận (LH+LL) 🔴
- Nến xám = pha trung lập hoặc chuyển tiếp ⚪
- Không có hình chữ nhật chồng chéo: bấc và thân nến thực sự luôn hiển thị đầy đủ.
📋 Bảng điều khiển (góc)
Tóm tắt số lượng các vùng, dòng chảy & phạm vi đang hoạt động
🛠️ Cách sử dụng
⚙️ Cài đặt đề xuất
- Khung thời gian: H1 hoặc cao hơn (lý tưởng cho Smart Money).
- Tham số mặc định: hoạt động tốt cho Forex, chỉ số và tiền điện tử.
- Điều chỉnh độ nhạy: tăng cho thị trường biến động, giảm cho thị trường đi ngang lộn xộn.
📗 Quy tắc giao dịch :
✅ Vào lệnh dài (MUA)
- Nến phải xanh (xu hướng tăng đang hoạt động) 🟢
- Giá chạm hoặc tiếp cận vùng "CẦU" đang hoạt động 🟢
- Một hộp "TIẾP DIỄN" (không phải "ĐẢO CHIỀU") xuất hiện tại vùng đó ✅
- Bảng điều khiển hiển thị xác suất phá vỡ tăng > 60% trên phạm vi đang hoạt động (nếu có) 📊
✅ Vào lệnh ngắn (BÁN)
- Nến phải hồng/đỏ (xu hướng giảm đang hoạt động) 🔴
- Giá chạm hoặc tiếp cận vùng "CUNG" đang hoạt động 🔴
- Một hộp "TIẾP DIỄN" (không phải "ĐẢO CHIỀU") xuất hiện tại vùng đó ✅
- Bảng điều khiển hiển thị xác suất phá vỡ giảm > 60% 📊
❌ Không giao dịch nếu...
- Nến xám (không có xu hướng rõ ràng) ⚪
- Một tín hiệu "ĐẢO CHIỀU" xuất hiện ngay tại điểm bạn định vào lệnh ⚠️
- Giá nằm trong phạm vi màu xanh chưa có phá vỡ rõ ràng 🔵
- Bảng điều khiển hiển thị sự hội tụ ngược lại (hội tụ giảm trong thiết lập tăng, hoặc ngược lại) 🔄
📈 Giải thích bảng điều khiển
văn bản
═══ SMART MONEY PRO ═══
Xu hướng: TĂNG ▲ ← Xu hướng thị trường hiện tại
Vùng tăng: 2 Vùng giảm: 1 ← Vùng thanh khoản đang hoạt động
Dòng tiếp diễn: 3 Dòng đảo chiều: 0 ← Tiếp diễn so với đảo chiều
Phạm vi: 4 (đang hoạt động: 1) ← Tổng và phạm vi đang hoạt động
Phạm vi hoạt động ▲65% ▼35% ← Xác suất phá vỡ
⚡ HỘI TỤ TĂNG ← Tín hiệu căn chỉnh tối đa
💡 Nguyên tắc chính
- ✅ Không vẽ lại: mọi thứ được tính toán chỉ dựa trên dữ liệu thanh đã đóng.
- ✅ Biểu đồ sạch: nến thực màu sắc, vùng bán trong suốt, không rối mắt.
- ✅ Xem trước cấu trúc: màu nến cho bạn biết pha thị trường trước khi các điểm xoay rõ ràng.
- ✅ Hội tụ tích hợp: khi vùng hoạt động + phạm vi hoạt động + tín hiệu dòng chảy đều đồng thuận, bảng điều khiển sẽ báo rõ cho bạn.
Tóm tắt
Key features include:
- **Institutional Flows:** Draws horizontal lines and colored boxes between significant pivots, labeling flows as "CONTINUATION" or "REVERSAL" to indicate trend respect or break.
- **Supply and Demand Zones:** Highlights unexecuted institutional orders with horizontal bands around pivots, distinguishing supply (sell) and demand (buy) zones that expire or break upon price penetration.
- **Range Detection:** Identifies consolidation ranges using an SMA with ATR bands, marking them with blue rectangles and providing breakout probability percentages based on momentum, volume, and time distribution.
- **Dashboard:** Displays numeric summaries of active zones, flows, ranges, and breakout probabilities, including confluence signals when multiple factors align.
Recommended for use on H1 or higher timeframes, the indicator suits Forex, indices, and cryptocurrencies. It operates without repainting by relying on closed bar data and maintains a clean chart presentation with visible candle wicks and bodies.
Đánh giá của khách hàng
5 | 50 % | |
4 | 0 % | |
3 | 0 % | |
2 | 50 % | |
1 | 0 % |


