Mô tả
Chỉ báo Pinescriptlabs Store: Pinescriptlabs Store cBots : (cBot) Gold & BTC BreakoutSession Pivots(mới)
Thuật toán Thông minh Theo dõi (mới)
Hỗ trợ &
Kháng cự SmartTrend
Đường
Phân tích
Cấu trúc Thị trường
Động
của
Các điểm
Quay đầu
Hồi quy
Tuyến tính
Fibonacci
Đa khung thời gian
Khoảng cách Giá Trị Công bằng Động lực
Theo dõi
Định hướng Nến
Đa cấp
Tự động
Hỗ trợ và
Kháng cự
Xu hướng
Đường
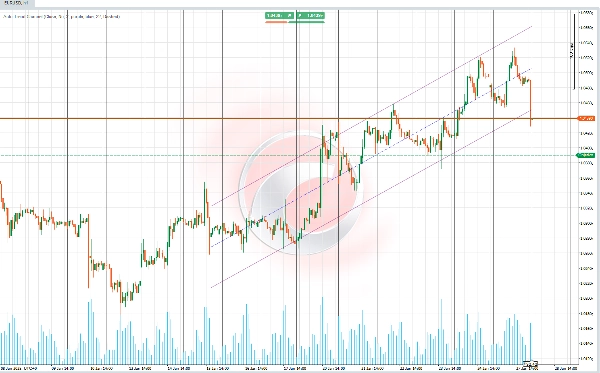
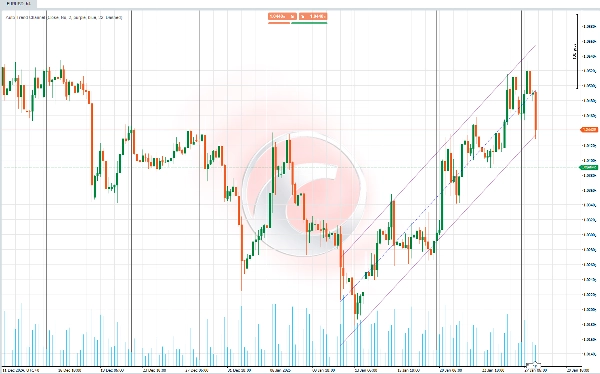
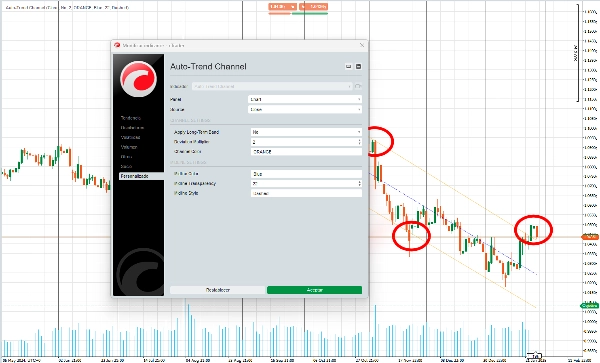
📊 Kênh Xu hướng Tự động 📊
Chỉ báo này vẽ một kênh xu hướng dựa trên phép tính hồi quy tuyến tính và độ lệch chuẩn của dữ liệu giá (logarit) cho một khoảng thời gian được chọn tự động. 📈 Khoảng thời gian được xác định bằng cách sử dụng hệ số tương quan Pearson (RRR), chọn khoảng thời gian có giá trị tuyệt đối cao nhất. 🧮
✨ Chức năng chính ✨
Chức năng chính là tính toán một kênh xu hướng tự động thích ứng với độ dài khoảng thời gian đại diện nhất, sử dụng thống kê nâng cao để xác định hỗ trợ, kháng cự, và đường xu hướng trung tâm.
Kênh bao gồm:
1️⃣ Một đường cơ sở đại diện cho xu hướng tuyến tính được tính toán.
2️⃣ Đường trên và dưới xác định các dải kênh ở khoảng cách tỷ lệ với độ lệch chuẩn.
🚀 Tính năng và Phép tính 🚀
🔎 Tính toán Khoảng thời gian Tối ưu
- Chỉ báo đánh giá nhiều khoảng thời gian dữ liệu (ngắn hoặc dài, tùy cấu hình) để tìm ra khoảng thời gian có tương quan chính xác nhất với hành vi thị trường.
- Hệ số tương quan Pearson được sử dụng làm chỉ số chính để xác định khoảng thời gian có mối quan hệ mạnh nhất giữa giá lịch sử và đường xu hướng tạo ra.
📐 Hồi quy Tuyến tính và Dự báo Giá
- Đối với mỗi khoảng thời gian được đánh giá, một đường hồi quy được tính dựa trên logarit tự nhiên của giá để ổn định các biến động cực đoan.
- Các thành phần chính của phép tính bao gồm:
-
- Độ dốc: Đại diện cho tốc độ thay đổi giá.
- Giao điểm: Điểm bắt đầu của đường dự báo.
- Trung bình: Thiết lập đường cơ sở tham chiếu.
📊 Độ lệch Chuẩn và Giới hạn Kênh
- Tính toán độ lệch chuẩn của giá so với đường hồi quy.
- Dải trên (kháng cự) và dải dưới (hỗ trợ) được xác định bằng cách điều chỉnh đường trung tâm với hệ số nhân độ lệch chuẩn do người dùng cấu hình.
🌈 Hiển thị Kênh Xu hướng
- Kênh bao gồm ba thành phần chính:
-
- Đường Trung tâm: Hiển thị xu hướng chính dựa trên đường hồi quy.
- Đường Trên: Đại diện cho giới hạn trên của kênh (kháng cự), được điều chỉnh theo độ lệch chuẩn.
- Đường Dưới: Đại diện cho giới hạn dưới của kênh (hỗ trợ), được điều chỉnh theo độ lệch chuẩn.
- Người dùng có thể tùy chỉnh màu sắc, độ trong suốt và kiểu đường để tăng tính rõ ràng trực quan.
🎛️ Khả năng Thích nghi và Cấu hình
- Người dùng có thể cá nhân hóa nhiều khía cạnh của chỉ báo, chẳng hạn như:
-
- Các màu sắc của các đường và kênh.
- Tập trung vào khoảng thời gian dài (xu hướng vĩ mô) hoặc khoảng thời gian ngắn (xu hướng vi mô).
- Khả năng thích nghi này đảm bảo chỉ báo phù hợp với các phong cách giao dịch và sở thích trực quan khác nhau.
🔍 Sử dụng :
1️⃣ Xác định Xu hướng
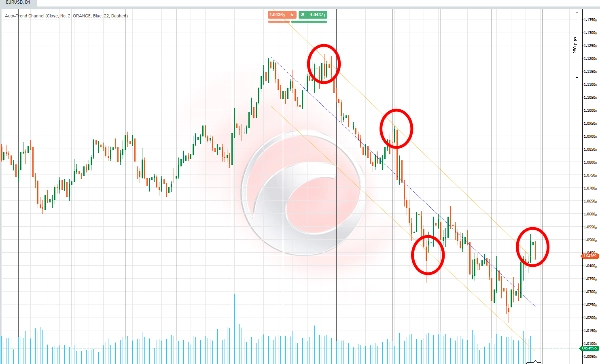
- Đường trung tâm của kênh giúp xác định thị trường đang trong xu hướng tăng, giảm, hoặc đi ngang.
2️⃣ Hỗ trợ và Kháng cự Động
- Đường trên và dưới của kênh đóng vai trò là các vùng tiềm năng nơi giá có thể đảo chiều hoặc tích lũy.
3️⃣ Phát hiện Tích lũy và Phá vỡ
- Giá duy trì trong kênh cho thấy sự tích lũy, trong khi một cú phá vỡ báo hiệu thay đổi xu hướng hoặc một biến động giá mạnh.
4️⃣ Điều chỉnh cho Các Phong cách Giao dịch Khác nhau
- Khoảng thời gian dài hữu ích để xác định xu hướng chung và đưa ra quyết định chiến lược trong các khung thời gian rộng hơn.
- Khoảng thời gian ngắn cho phép nhà giao dịch nắm bắt biến động nhanh hơn và phản ứng với các thay đổi thị trường ngay lập tức.
Tóm tắt
Key features include:
- Optimal period selection by evaluating multiple data intervals to find the strongest correlation between historical prices and the trend line.
- Calculation of slope, intercept, and mean for precise linear regression and price projection.
- Visualization of the trend channel with customizable colors, transparency, and line styles.
- Adaptability for different trading styles by allowing focus on long-term (macro) or short-term (micro) trends.
Use cases:
- Identifying market trends (uptrend, downtrend, sideways) via the central trend line.
- Detecting dynamic support and resistance zones where price may reverse or consolidate.
- Recognizing consolidation phases within the channel and breakouts signaling trend changes or strong price movements.
- Adjusting analysis to suit strategic decisions or faster market responses depending on selected period length.
This indicator supports various markets including cryptocurrencies (BTCUSD), commodities (XAUUSD), and others, providing a statistical approach to trend and channel analysis.
Đánh giá của khách hàng
5 | 60 % | |
4 | 20 % | |
3 | 20 % | |
2 | 0 % | |
1 | 0 % |