
Beschreibung
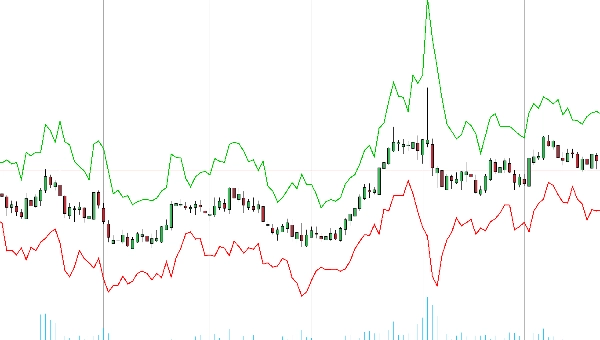
ATR-Bänder zeigen dynamisch obere und untere Bänder auf Ihren Preischarts an.
Diese Bänder bieten Echtzeiteinblicke in die Marktvolatilität und helfen Ihnen, potenzielle Ausbruchs- und Umkehrpunkte präzise zu identifizieren. Perfekt für Trader aller Erfahrungsstufen verbessern ATR-Bänder Ihren Entscheidungsprozess, indem sie klare visuelle Hinweise zum Setzen von Stop-Loss, Take-Profit und zur Optimierung von Einstiegspunkten liefern.
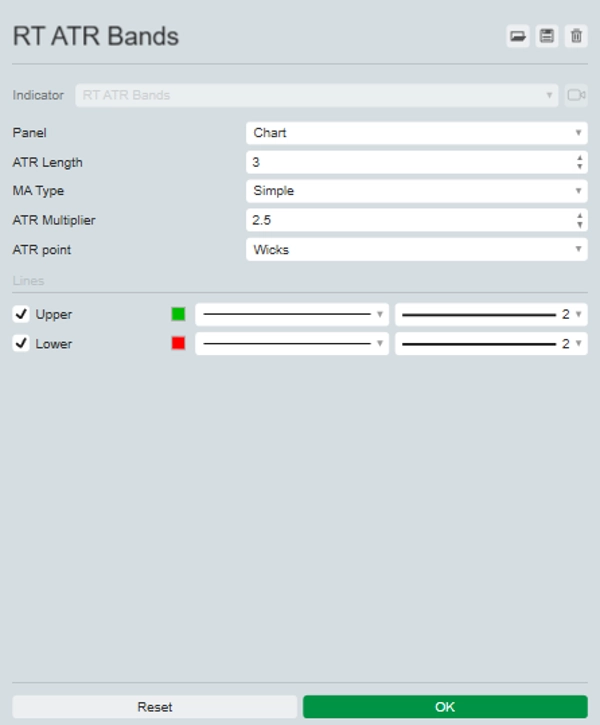
Die Einstellungen ermöglichen es, Ihren bevorzugten Zeitraum und Multiplikator auszuwählen, den gleitenden Durchschnitt zu ändern, der zur Berechnung des ATR verwendet wird, und Kerzendochte oder Kerzenschluss zu verwenden.
Erweitern Sie noch heute Ihr Trading-Toolkit und erleben Sie den Unterschied mit ATR-Bändern – Ihrem Vorteil am Markt.


