

Beschreibung
Pinescriptlabs Store Indikatoren: Pinescriptlabs Store cBots : (cBot) Gold & BTC BreakoutSession Pivots(neu)
Erweiterte Marktstruktur: Bos, Choch, SwinLevels, Order Blocks, Marktstruktur & Liquiditätsfinder (Neu)
ZigZag Preis-Liquiditätsprojektion
Trailing Smart Algorithmus (neu)
Vorhersage basierend auf Linreg & ATR
SmartTrend Unterstützung &
Widerstand
Linien
Dynamische
Marktstruktur
Analyse
von
Wendepunkten
Punkten
Fibonacci
Lineare
Regression
Multi-Zeitrahmen
Multi-Level
Kerzen-Bias
Tracker
Reaktive Gleitender Durchschnitt
Auto
Unterstützung und
Widerstand
Trend
Linien
Alle
Unterstützungs- und
Widerstandsniveaus
Levels
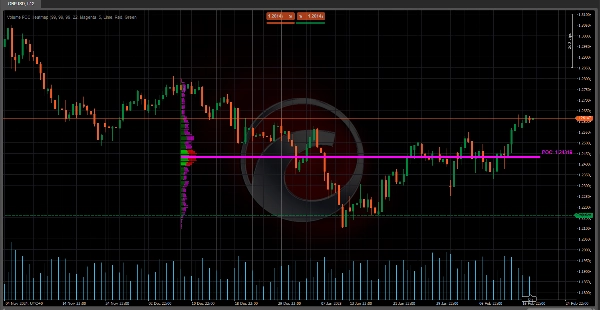
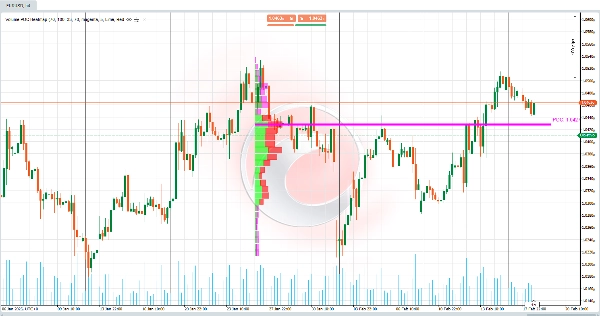
🔥 Volume POC Heatmap 🔥
Dieser Indikator ist ein Volumenprofil , das die Verteilung des gehandelten Volumens über verschiedene Preisniveaus während eines bestimmten Zeitraums anzeigt. Sein Hauptziel ist es, wichtige Unterstützungs-/Widerstandsbereiche und Bereiche zu identifizieren, in denen der Markt das größte Interesse gezeigt hat (hohe Kauf-/Verkaufsaktivität). Es ist super nützlich für:
- Erkennung des Point of Control (POC) 🎯
Das Preisniveau mit dem höchsten Volumen, das als Magnet für die Kursbewegung wirkt. - Visualisierung des Wertbereichs (VA)
Die Zone, in der ein bestimmter Prozentsatz des Gesamtvolumens konzentriert ist (z. B. 70 %), was auf ein Gleichgewicht zwischen Käufern und Verkäufern hinweist. - Unterscheidung von bullischem und bärischem Volumen 📈📉
Zeigt, wo Kaufkraft vs. Verkaufsdruck sich ansammelt.
🧠 Wichtige Logik & Berechnungen 🔢
- Preisbereichsaufteilung 📏
-
- Der Preisbereich (vom niedrigsten bis zum höchsten der letzten B Bars ) wird in Volumenzellen (CNum) unterteilt.
Beispiel: Wenn CNum = 33 , wird der Bereich in 33 gleichmäßige Ebenen aufgeteilt.
- Der Preisbereich (vom niedrigsten bis zum höchsten der letzten B Bars ) wird in Volumenzellen (CNum) unterteilt.
- Volumenverteilung nach Ebene 📊
-
- Für jeden Balken in den historischen Daten:
-
- Das Volumen, das mit dem Körper (Differenz zwischen Eröffnung und Schluss) und den Dochten (Hochs und Tiefs) verbunden ist, wird berechnet.
- Das Volumen wird proportional auf die Preiszellen verteilt, die vom Balken geschnitten werden.
Beispiel: Wenn ein grüner (bullischer) Balken 3 Zellen abdeckt, wird das Volumen hauptsächlich diesen Zellen als "bullisches Volumen" zugewiesen.
- Berechnung des Point of Control (POC) 🎯
-
- Der POC ist die Zelle mit dem höchsten akkumulierten Volumen, die den Preis repräsentiert, bei dem die größte Übereinstimmung zwischen Käufern und Verkäufern bestand.
- Berechnung des Wertbereichs (VA) 🔄
-
- Erweitert sich vom POC nach oben/unten, bis der angegebene % Anteil des Gesamtvolumens (z. B. 70 %) umfasst ist.
Beispiel: Wenn der VA von 100 bis 105 reicht, bedeutet dies, dass 70 % des Volumens innerhalb dieses Bereichs gehandelt wurden.
- Erweitert sich vom POC nach oben/unten, bis der angegebene % Anteil des Gesamtvolumens (z. B. 70 %) umfasst ist.
- Visuelle Normalisierung 🖼️
-
- Volumen werden mit einem Skalenfaktor skaliert, um die Breite der Balken im Diagramm anzupassen und die Visualisierung zu erleichtern.
🛠️ Schlüssel der Volume POC Heatmap 💡
- Mangel an Kontext in traditionellen Volumenindikatoren 🤔
Klassische Volumenindikatoren (wie Volumen pro Balken) zeigen nicht, wo das Volumen gehandelt wurde. Dieser Indikator kartiert das Volumen nach Preisniveau und löst dieses Problem. - Organische Unterstützung/Widerstandserkennung 🚀
Zonen mit hohem Volumen wirken als dynamische Unterstützung/Widerstand, zuverlässiger als statische Linien. - Erkennung von Ungleichgewichten ⚖️
Bereiche mit überwiegend bullischem oder bärischem Volumen signalisieren potenzielle Ausbrüche oder Umkehrungen.
💡 Praktische Anwendung im Trading 📈
- POC als Interessenszone 🎯
-
- Wenn der Preis sich dem POC nähert, sind Reaktionen wie Abpraller oder Konsolidierungen zu erwarten.
- Wertbereich (VA) als Gleichgewichtszone 🔄
-
- Wenn der Preis außerhalb des VA liegt, neigt er dazu, dorthin zurückzukehren (magnetischer Effekt).
- Wenn der Preis innerhalb des VA liegt, kann dies auf eine Konsolidierung hinweisen.
- Bullisches/Bärisches Volumen als Bestätigung 🔍
-
- Ein Anstieg des bullischen Volumens am Widerstand deutet auf einen potenziellen Ausbruch hin.
- Hohes bärisches Volumen an der Unterstützung weist auf einen möglichen Zusammenbruch hin.
🌟 Beispiel 📊
Verwendete Parameter (sichtbar & konfigurierbar für den Benutzer):
- Bars Back = 55 → Anzahl der analysierten historischen Balken.
- Volumenzellen = 33 → Anzahl der Unterteilungen/Zellen im Preisbereich.
- Wertbereichsvolumen % = 70 → Prozentsatz des Volumens, der den Wertbereich definiert.
Situation:
- Der Preis durchbricht ein technisches Unterstützungsniveau, aber das Volumen in dieser Zone ist gering (laut Profil).
- Später kehrt der Preis zum Wertbereich (VA) zurück, der durch 70 % des Gesamtvolumens definiert ist.
Interpretation:
- Der Ausbruch war falsch (aufgrund des geringen Volumens in der Ausbruchszone).
- Der Markt sucht innerhalb des Wertbereichs ein Gleichgewicht, wo eine höhere Aktivität (hohe Volumendichte) herrscht.
Aktion:
- Suche nach Kaufgelegenheiten in der Nähe der unteren Grenze des VA oder des POC, da dies Zonen mit hohem Interesse für Marktteilnehmer sind.
Zusammenfassung
Key functionalities include:
- Division of the price range into multiple volume cells for detailed volume mapping.
- Calculation of POC as the volume consensus price.
- Determination of the Value Area around the POC.
- Visual normalization of volume bars for clearer chart representation.
This tool addresses the limitation of traditional volume indicators by showing where volume was traded rather than just total volume per bar. It helps identify dynamic support and resistance zones based on volume concentration and detects volume imbalances that may signal potential breakouts or reversals. Traders can use it to anticipate price reactions near the POC and VA, aiding in decision-making for entries and exits. Configurable parameters include the number of historical bars analyzed, volume cells, and the percentage defining the Value Area.
Kundenbewertungen
5 | 100 % | |
4 | 0 % | |
3 | 0 % | |
2 | 0 % | |
1 | 0 % |


![„Smart Money Concepts (SMC) [Iridio Capital]“-Logo](https://cdn.ctrader.com/image/webp/28b69fd1-ef54-4bed-9487-07e78e883be4_40934)


