
Beschreibung
Pinescriptlabs Store Indikatoren: Pinescriptlabs Store cBots : (cBot) Gold & BTC BreakoutSession Pivots(neu)
Erweiterte Marktstruktur: Bos, Choch, SwinLevels, Order Blocks, Marktstruktur & Liquiditätsfinder (Neu)
ZigZag Preis-Liquiditätsprojektion
Trailing Smart Algorithmus (neu)
Vorhersage basierend auf Linreg & ATR
SmartTrend Unterstützung &
Widerstand
Linien
Dynamische
Marktstruktur
Analyse
von
Wendepunkten
Punkten
Fibonacci
Lineare
Regression
Multi-Zeitrahmen
Multi-Level
Kerzen-Bias
Tracker
Reaktive Gleitender Durchschnitt
Auto
Unterstützung und
Widerstand
Trend
Linien
Alle
Unterstützungs- und
Widerstandsebenen
Levels
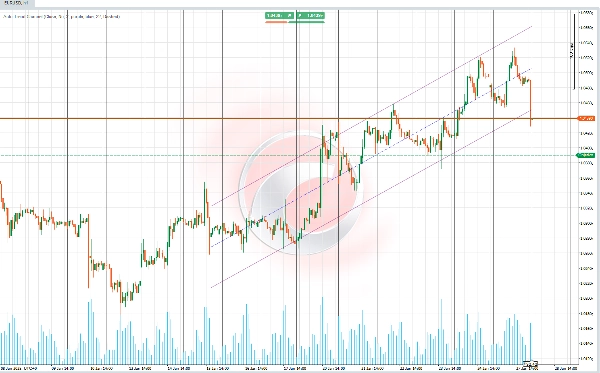
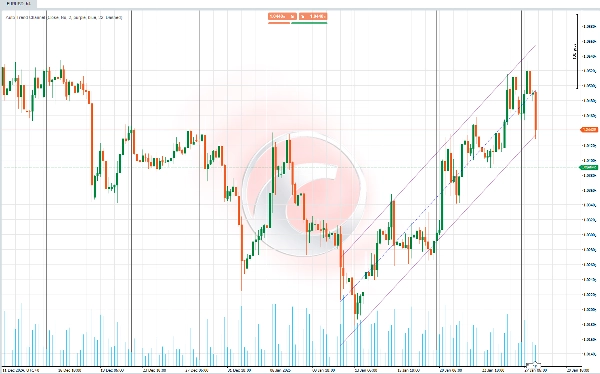
📊 Auto-Trendkanal 📊
Dieser Indikator zeichnet einen Trendkanal basierend auf der Berechnung der linearen Regression und der Standardabweichung der Preisdaten (logarithmisch) für einen automatisch ausgewählten Zeitraum. 📈 Der Zeitraum wird unter Verwendung des Pearson-Korrelationskoeffizienten (RRR) bestimmt, wobei der mit dem höchsten Absolutwert gewählt wird. 🧮
✨ Hauptfunktionalität ✨
Die Hauptfunktion besteht darin, einen Trendkanal zu berechnen, der sich automatisch an die repräsentativste Periodenlänge anpasst, wobei fortgeschrittene Statistik verwendet wird, um Unterstützung, Widerstand und die zentrale Trendlinie zu definieren.
Der Kanal umfasst:
1️⃣ Eine Basislinie, die den berechneten linearen Trend darstellt.
2️⃣ Obere und untere Linien, die die Kanalbänder in einem Abstand proportional zur Standardabweichung definieren.
🚀 Funktionen und Berechnungen 🚀
🔎 Optimale Periodenberechnung
- Der Indikator bewertet mehrere Datenperioden (kurz oder lang, je nach Konfiguration), um diejenige mit der genauesten Korrelation zum Marktverhalten zu finden.
- Die Pearson-Korrelation wird als Schlüsselmetrik verwendet, um die Periode mit der stärksten Beziehung zwischen historischem Preis und der generierten Trendlinie zu identifizieren.
📐 Lineare Regression und Preisprojektion
- Für jede bewertete Periode wird eine Regressionslinie basierend auf dem natürlichen Logarithmus der Preise berechnet, um extreme Schwankungen zu stabilisieren.
- Wichtige Bestandteile der Berechnung sind:
-
- Steigung: Repräsentiert die Änderungsrate des Preises.
- Achsenabschnitt: Der Startpunkt der projizierten Linie.
- Mittelwert: Legt eine Referenzbasislinie fest.
📊 Standardabweichung und Kanallimits
- Die Standardabweichung der Preise relativ zur Regressionslinie wird berechnet.
- Das obere Band (Widerstand) und das untere Band (Unterstützung) werden durch Anpassung der Mittellinie mit einem benutzerkonfigurierbaren Standardabweichungs-Multiplikator abgeleitet.
🌈 Visualisierung des Trendkanals
- Der Kanal besteht aus drei Hauptelementen:
-
- Mittellinie: Zeigt den Haupttrend basierend auf der Regressionslinie.
- Obere Linie: Repräsentiert die obere Grenze des Kanals (Widerstand), angepasst durch die Standardabweichung.
- Untere Linie: Repräsentiert die untere Grenze des Kanals (Unterstützung), angepasst durch die Standardabweichung.
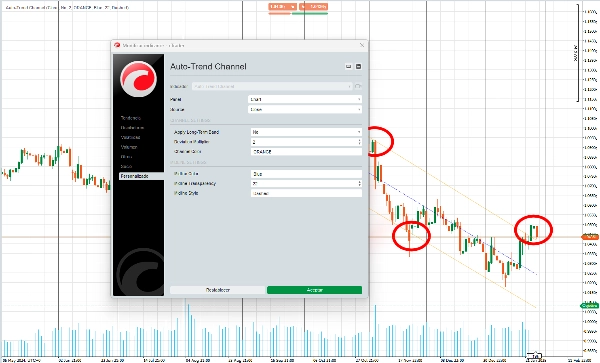
- Benutzer können die Farben, Transparenz und Linienstile des Kanals für bessere visuelle Klarheit anpassen.
🎛️ Anpassungsfähigkeit und Konfiguration
- Benutzer können verschiedene Aspekte des Indikators personalisieren, wie zum Beispiel:
-
- Die Farben der Linien und des Kanals.
- Ob der Fokus auf langen Perioden (Makrotrends) oder kurzen Perioden (Mikrotrends) liegt.
- Diese Anpassungsfähigkeit stellt sicher, dass der Indikator zu verschiedenen Handelsstilen und visuellen Vorlieben passt.
🔍 Verwendung :
1️⃣ Trenderkennung
- Die Mittellinie des Kanals hilft zu bestimmen, ob sich der Markt in einem Aufwärtstrend, Abwärtstrend oder Seitwärtstrend befindet.
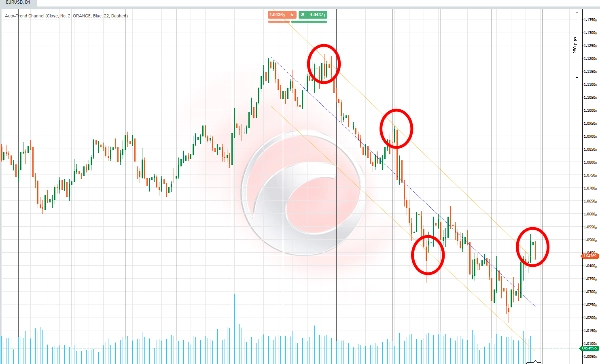
2️⃣ Dynamische Unterstützung und Widerstand
- Die oberen und unteren Kanallinien fungieren als potenzielle Zonen, in denen der Preis umkehren oder konsolidieren könnte.
3️⃣ Konsolidierungs- und Ausbruchserkennung
- Preise, die innerhalb des Kanals bleiben, deuten auf Konsolidierung hin, während ein Ausbruch eine Trendänderung oder eine starke Preisbewegung signalisiert.
4️⃣ Anpassung an verschiedene Handelsstile
- Lange Perioden sind nützlich, um allgemeine Trends zu erkennen und strategische Entscheidungen in größeren Zeitrahmen zu treffen.
- Kurze Perioden ermöglichen es Händlern, schnellere Bewegungen zu erfassen und auf unmittelbare Marktveränderungen zu reagieren.
Zusammenfassung
Key features include:
- Optimal period selection by evaluating multiple data intervals to find the strongest correlation between historical prices and the trend line.
- Calculation of slope, intercept, and mean for precise linear regression and price projection.
- Visualization of the trend channel with customizable colors, transparency, and line styles.
- Adaptability for different trading styles by allowing focus on long-term (macro) or short-term (micro) trends.
Use cases:
- Identifying market trends (uptrend, downtrend, sideways) via the central trend line.
- Detecting dynamic support and resistance zones where price may reverse or consolidate.
- Recognizing consolidation phases within the channel and breakouts signaling trend changes or strong price movements.
- Adjusting analysis to suit strategic decisions or faster market responses depending on selected period length.
This indicator supports various markets including cryptocurrencies (BTCUSD), commodities (XAUUSD), and others, providing a statistical approach to trend and channel analysis.
Kundenbewertungen
5 | 60 % | |
4 | 20 % | |
3 | 20 % | |
2 | 0 % | |
1 | 0 % |


