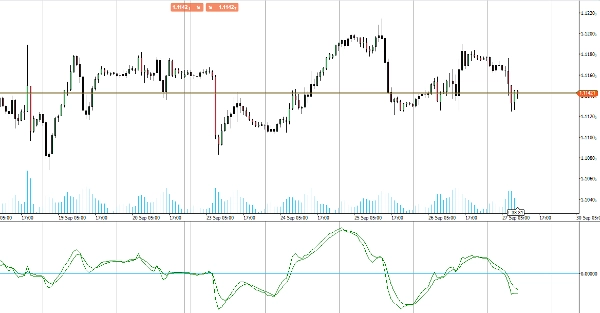
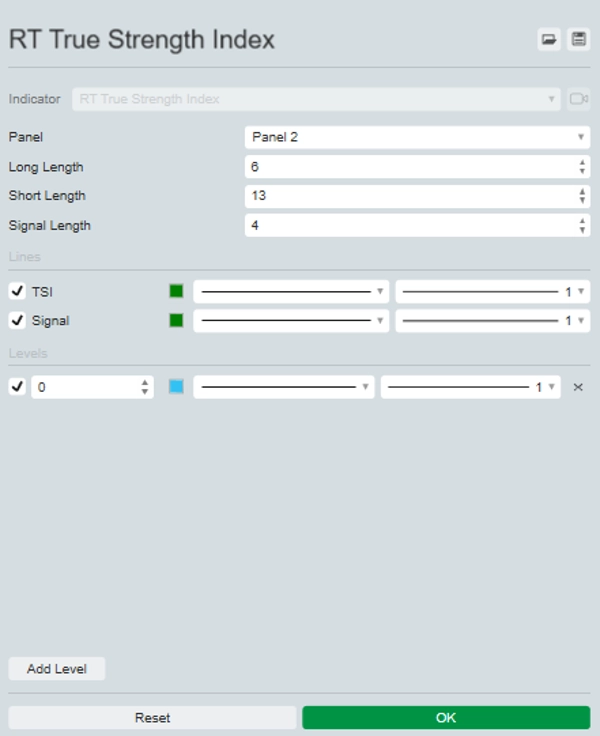
Indikator
NAS100
Indices
NZDUSD
XAUUSD
Commodities
Stocks
Forex
EURUSD
GBPUSD
Crypto
BTCUSD
USDJPY
RT True Strength Index
„RT True Strength Index“-Logo
25/09/2025
1
Desktop
Since 25/09/2024
Verkäufe
20
In „RT True Strength Index“ hochgeladenes BildIn „RT True Strength Index“ hochgeladenes Bild

Introducing the True Strength Index (TSI) indicator, a powerful tool designed to enhance your trading strategy by providing clear insights into market momentum and trend strength.

The TSI indicator measures the underlying strength of price movements, smoothing out market noise to give you a more accurate picture of trend direction. By highlighting overbought and oversold conditions, TSI helps you identify potential reversal points and confirm trend continuations.

TSI uses moving averages of the underlying momentum of a financial instrument. Momentum is considered a leading indicator of price movements, and a moving average characteristically lags behind price. The TSI combines these characteristics to create an indication of price and direction more in sync with market turns than either momentum or moving average.

Perfect for traders seeking to refine their analysis and improve decision-making, the TSI indicator offers a reliable and intuitive way to gauge market dynamics. Upgrade your trading toolkit with the True Strength Index for superior trading performance.

Mehr von diesem Autor
Indikator
NAS100
NZDUSD
XAUUSD
+11
RT VWAP
Unlock VWAP in cTrader! Choose anchor periods, price sources, and display deviation bands with real-time tick updates.
RT TradingView ATR
Upgrade to ATR-RMA! Experience the precise ATR using Relative Moving Average for accurate volatility analysis in cTrader
Indikator
Indices
RSI
XAUUSD
+9
RT Stochastic RSI PRO
Unlock Stochastic RSI PRO in cTrader! Overlay RSI, highlight zones, and identify divergences with customizable settings.
Indikator
NAS100
NZDUSD
XAUUSD
+10
RT Standard Deviation Channel_noSourceCode
Visualize trends with Standard Deviation Channel! Display median, and add customizable upper/lower deviation channels.
Indikator
NAS100
NZDUSD
XAUUSD
+12
RT Bollinger Bands Cloud
Visualize Bollinger Bands with a colored cloud for clarity. Enhance your trading precision with this dynamic indicator!
Indikator
NAS100
NZDUSD
XAUUSD
+10
RT Time Segmented Volume
Enhance trading with TSV! Analyze volume flow and price trends using the powerful Time Segmented Volume indicator.
Indikator
NAS100
Indices
NZDUSD
+9
RT Relative Moving Average
Bring the RMA to cTrader! This is the Relative Moving Average from TradingView.
Das könnte Sie auch noch interessieren
Indikator
Indices
Prop
Commodities
+4
Pivot Point Smart Money Concept
Transform your approach to trading with our innovative Pivot Point Indicator.
Indikator
XAUUSD
Forex
EURUSD
+2
Risk & Reward Trading Tool Pro.v2.15
This is a tool to help traders open orders/close orders/modify orders quickly with just one click
Indikator
VWAP
Breakout
Scalping
VWAP & Sessions & D,W,M HLO Levels
Killzone Session With VWAP – Precision Meets Price Action
Indikator
RSI
XAUUSD
ATR
+3
RSI NextGen
The RSI NextGen is an advanced and modernized version of the classic Relative Strength Index (RSI)
Indicatore livelli numeri tondi_fabio23.traders
Indicatore dei livelli numeri tondi sul grafico , regolabile.Indicator of levels round numbers on the graph, adjustable
Indikator
Indices
Stocks
Commodities
+2
SymbolTFOverlay
The SymbolTFOverlay display the current symbol and timeframe as a semi-transparent text overlay on the chart.
Indikator
NAS100
Indices
Breakout
+6
All-in-One Session Levels Suite
Institutional Session Levels Pro OHLC,Prev(D,W,M OHLC)
Indikator
RSI
Breakout
Supertrend
+1
Reactive Moving Average
Combines SMA with dynamic correlation to adapt to market trends. Adjusts sensitivity, filters noise🚀📉
ICT MACRO THEORY
Are essentially short intervals during which the algorithm seeks liquidity or adjusts price.....
ScalperSignalVisual
Overview of the Fade Breakout Visualizer Indicator
Indikator
Indices
RSI
Bollinger
Clustering
Clustering tool for traders with visual insights into market patterns.
Head Shoulders Finder
Detects Head & Shoulders patterns, plots signals, and alerts for trading opportunities.
Indikator
Bollinger
E7 Indicators Free Overlays
Bollinger Band Cloud, Heiken Ashi, Trend Follower and Parabolic SAR.
Indikator
XAUUSD
Breakout
Stocks
+6
Signal Strike
Signal Strike is a professional trading indicator delivers clear, high‑confidence entry signals directly on your chart
IR Multi Data
show symbol and time fram, daily net profit percent, daily net profit, and spread ln your chart. consider that timezone
Fibonacci Pitchfan
Powerful all-in-one tool for traders seeking a clear, dynamic view of market structure. By merging pivots, trendlines &
Beste Ratings
„STC“-Logo
5.0
(2)
Kostenlos
STC
Schaff Trend Cycle (STC) Indicator
Zigzag T3
Three ZigZag lines