
Beschreibung
📈 PineScriptLabs Smart Signals CDRC [Auto TP/SL]
❓ Was ist dieser Indikator?
Das Dynamic Close Range Channels (CDRC) System ist ein Indikator, der auf der PineScriptLabs-Theorie entwickelt wurde und zwei unabhängige Kanäle verwendet, um Kauf-/Verkaufssignale 📊 zu generieren und automatisch dynamische Gewinnziele (TP) und Stop Loss (SL) 🎯 zu berechnen, die niemals gleich sind.
🎯 Spezieller dynamischer TP/SL-Algorithmus ⚡
Im Gegensatz zu Systemen, die feste Niveaus oder ATR verwenden, berechnet dieser Algorithmus TP und SL basierend auf der tatsächlichen Kursbewegung seit dem letzten Signal:
• Für LONG 📈: Misst die Entfernung vom niedrigsten aufgezeichneten Preis bis zum Einstieg, berechnet den Prozentsatz dieser Bewegung, und projiziert diesen Prozentsatz nach oben zur Festlegung der Ziele
• Für SHORT 📉: Misst die Entfernung vom höchsten aufgezeichneten Preis bis zum Einstieg und projiziert diesen Prozentsatz nach unten
🎯 Das bedeutet, dass jeder Trade einzigartige Niveaus hat, die an den spezifischen Markt Kontext zu diesem Zeitpunkt angepasst sind und den realen Momentum vor dem Signal widerspiegeln 💡
📊 Die CDRC-Theorie: Kanalaufbau 🏗️
Technische Grundlage 🔍
Die CDRC-Theorie baut Kanäle ausschließlich auf Schlusskursbereichen auf, nicht auf Volatilität oder Standardabweichung. Schlusskurse repräsentieren den realen Marktkonsens und eliminieren Dochtgeräusche 🎯
Aufbauprozess ⚙️
- Durchschnittlicher Preis: Durchschnitt aller Periodenschlüsse
- Bereich: Differenz zwischen höchstem und niedrigstem Schluss der Periode
- Amplitude: Bereich × Multiplikator ÷ 2
- Bänder:
o Oben = Durchschnittspreis + Amplitude ↗️
o Unten = Durchschnittspreis - Amplitude ↘️
🔄 Kanäle werden bei jedem Balken neu berechnet, passen sich ständig dem Markt an
⚙️ Wie funktioniert es?
Zwei gleichzeitige Kanäle 📊📊
• Kanal 1 (Schnell - 111 Balken): Reagiert schnell auf Veränderungen, Multiplikator 0,14 ⚡
• Kanal 2 (Langsam - 388 Balken): Langfristige Sicht, Multiplikator 0,11 🐢
Signalgenerierung 🎯
• LONG ✅: Preis schließt über dem oberen Band von BEIDEN Kanälen für 2 aufeinanderfolgende Balken 🟢
• SHORT ✅: Preis schließt unter dem unteren Band von BEIDEN Kanälen für 2 aufeinanderfolgende Balken 🔴
🛡️ Duale Bestätigung filtert falsche Signale
🤖 Automatische TP/SL-Berechnung (Algorithmus-Details)
Für LONG 📈:
- System zeichnet kontinuierlich den niedrigsten Preis seit dem letzten Signal auf
- Beim Generieren eines Kaufsignals wird berechnet: Prozentsatz = (Einstieg - Minimum) / Einstieg × 100
- Projiziert diesen Prozentsatz nach oben vom Einstieg, um TP3 festzulegen
- Teilt den Bereich in drei Zonen: TP1 (33%), TP2 (66%), TP3 (100%)
- SL = Einstieg - (Einstieg × Prozentsatz × Stop-Loss-Verhältnis / 100)
Für SHORT 📉:
- System zeichnet kontinuierlich den höchsten Preis seit dem letzten Signal auf
- Beim Generieren eines Verkaufssignals wird berechnet: Prozentsatz = (Maximum - Einstieg) / Einstieg × 100
- Projiziert diesen Prozentsatz nach unten vom Einstieg, um TP3 festzulegen
- Teilt den Bereich in drei progressive Zonen
- SL = Einstieg + (Einstieg × Prozentsatz × Stop-Loss-Verhältnis / 100)
🎯 Ergebnis: Jeder Trade hat einzigartige Niveaus, die entsprechend dem spezifischen Marktmomentum zu diesem Zeitpunkt berechnet werden
👀 Visualisierung 🎨
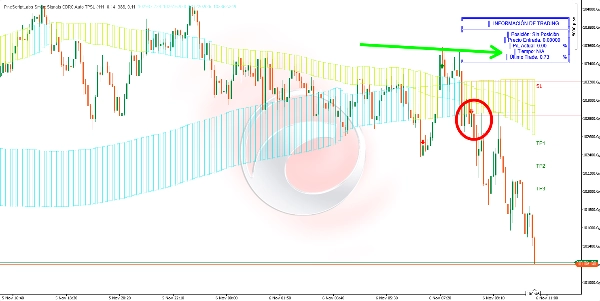
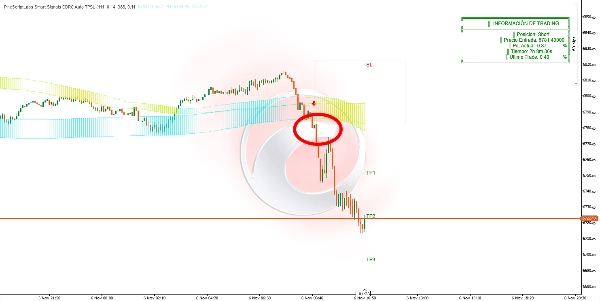
• Punkte: Bänder beider Kanäle
• Dynamische Füllung: Kanäle ändern die Farbe bei Durchdringung
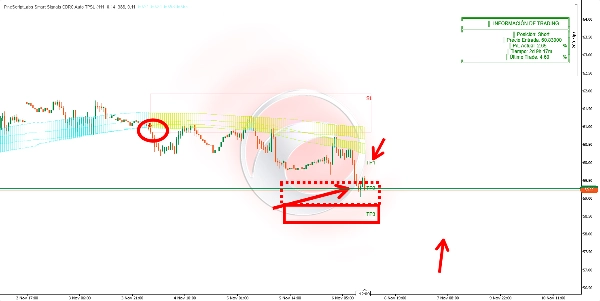
• Boxen: Einstiegszone (SL-Einstieg) und drei Zielzonen (progressive Transparenzen)
• Beschriftungen: SL, TP1, TP2, TP3 mit genauen Preisen 🏷️
• Pfeile: Grün (Kauf) 🟢 / Rot (Verkauf) 🔴
• Tabelle: Aktuelle Position, Einstiegspreis, aktueller P/L %, Zeit im Trade, letzter geschlossener Trade 📋
🎯 Wozu dient es?
- Hochwahrscheinliche Einstiege mit doppelter Zeitrahmenbestätigung ✅
- Adaptive automatische Risikosteuerung basierend auf der tatsächlichen Marktbewegung 🤖
- Einzigartige gestaffelte Ziele für jeden Trade entsprechend dem vorherigen Momentum 🎯
- Dynamische Anpassung an das jüngste Kursverhalten 🔄
- Echtzeitüberwachung der Positionsleistung 📊
🛠️ Wie benutzt man es?
Einstieg 🚀: Einstieg beim Schluss des Balkens, wenn der Pfeil erscheint
Management 💼:
• TP1: 33% der projizierten Bewegung (Teilgewinne) 💰
• TP2: 66% der Bewegung (mehr Gewinne) 💰💰
• TP3: 100% der Bewegung (Endziel) 🎯
• SL: Automatischen Stop Loss immer respektieren ⛔
Überwachung 👀: Tabelle zeigt aktuellen P/L in Echtzeit. System erkennt automatisch, wenn TP3 oder SL erreicht wird. Nur ein aktives Signal gleichzeitig ⚠️
⚙️ Parameter und Auswirkungen
Kanal 1 Periode (111):
• ↑ Mehr Balken = Weniger Signale, zuverlässiger, langsamer 🐢
• ↓ Weniger Balken = Mehr Signale, schneller, sensibler ⚡
Kanal 1 Multiplikator (0.14):
• ↑ Höher = Breite Bänder, weniger Signale, nur starke Bewegungen 💪
• ↓ Niedriger = Enge Bänder, mehr Signale, höhere Sensitivität 🎯
Kanal 2 Periode (388):
• ↑ Höher = Strenge Bestätigung, weniger Signale 🛡️
• ↓ Niedriger = Mehr Signale, weniger Filterung 📊
Kanal 2 Multiplikator (0.11):
• ↑ Höher = Strenge Filterung, konservativ 🎯
• ↓ Niedriger = Höhere Sensitivität, mehr Trades ⚡
Stop-Loss-Verhältnis (50%):
• 50% = 1:2-Verhältnis (professionelles Gleichgewicht: Risiko 1, Gewinn 2) ⚖️
• ↑ Richtung 100% = Weitläufiger SL, mehr Risiko, weniger Stop-Outs, schlechteres R:R 📉
• ↓ Richtung 1% = Enger SL, weniger Risiko, besseres R:R, mehr Stop-Outs 📈
🔑 Wichtige Überlegungen
• Marktspeicher 🧠: Zeichnet Preishochs und -tiefs seit dem letzten Signal für realistische und einzigartige Projektionen auf
• TP/SL sind nie gleich ⚖️: Jeder Trade hat Niveaus, die entsprechend seinem spezifischen Kontext berechnet werden
• Verpflichtende doppelte Bestätigung für 2 aufeinanderfolgende Balken ✅✅
• Nur ein aktives Signal gleichzeitig ⚠️
• Kanäle werden ständig neu berechnet und passen sich dem Markt an 🔄
• Boxen werden visuell verlängert um die Sichtbarkeit zu erhalten 👀
🚀 Über 10.000 Trader verwenden bereits unsere TOP Indikatoren🏆
👉 Erhalten Sie alle unsere TOP-Systeme hier:
_______________________________________________
📌 Marktstruktur-Indikatoren
· ✅ AdvancedMarket Structure: Bos, Choch, SwinLevels, Order Blocks, Market Structure& Liquidity Finder
· 🔄 Dynamische MarktstrukturAnalyse von Wendepunkten
· 🧱 Order Block
· ⚖️ Marktungleichgewicht
· ⛓️ BOS & CHOCH
· 🧠 ICT Power of 3
_______________________________________________
🔚 Smart Exit Systeme
· 📍 Trailing Smart Algorithmus
_______________________________________________
📐 ZigZag-Indikatoren
· 🔍 ZigZag Preisliquiditätsprojektion
· ➖ ZigZag
_______________________________________________
🧱 Support- & Resistance-Indikatoren
· 🟩 SmartTrend Support- & Resistance-Linien
· 🧱 Alle Support- und Resistance-Level
_______________________________________________
📊 Trend- & Kanalindikatoren
· 🔄 Auto-Trend-Kanal
· 📊 Supertrend
· 🔁 Reaktive gleitende Durchschnitt
_______________________________________________
💧 Volumen- & Liquiditätswerkzeuge
_______________________________________________
⚡ Momentum- & RSI-Indikatoren
· 🚀 Dynamisches Range Momentum
· 🔎 Multi-Level Candle Bias
Tracker
_______________________________________________
🔮 Prognose- & Projektionswerkzeuge
· 📐 Prognose basierend auf Linreg & ATR
· 📏 Fibonacci Lineare Regression Multi-Timeframe
· 📈 Volumengetriebener Marktfluss-Projektor
Zusammenfassung
Kundenbewertungen
5 | 67 % | |
4 | 0 % | |
3 | 33 % | |
2 | 0 % | |
1 | 0 % |


![„[Stellar Strategies] Market Session Ultimate“-Logo](https://cdn.ctrader.com/image/webp/61ffd537-0125-4246-9e72-42eca1791d64_28232)


