Descrizione
Indicatori Pinescriptlabs Store: Pinescriptlabs Store cBots : (cBot) Gold & BTC BreakoutSession Pivots(nuovo)
Proiezione della Liquidità del Prezzo ZigZag
Algoritmo Intelligente di Inseguimento (nuovo)
Mappa di Liquidazione della Leva
Previsione Basata su Linreg & ATR
Supporto SmartTrend &
Resistenza
Linee
Sistema di Breakout del Canale
Analisi
Dinamica
della Struttura di Mercato
dei
Punti di
Inversione
Regressione
Lineare
Fibonacci
Multi-timeframe
Proiezione del Flusso di Mercato
Gradiente di Tendenza Dinamico
Tracciatore
Bias Multi-Livello
Candele
Tracciatore di Estremi Zig-Zag
Linea
di Supporto e
Resistenza
di Tendenza
Auto
Tutti
i Livelli di
Supporto e
Resistenza
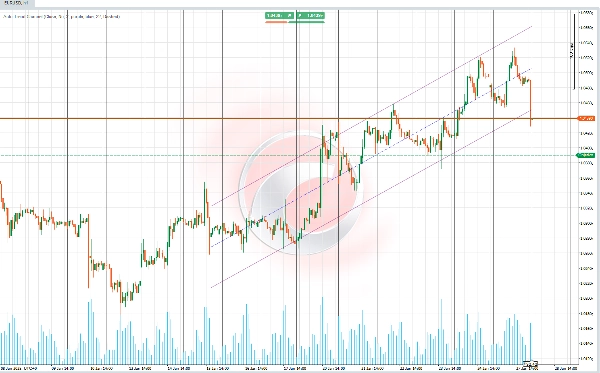
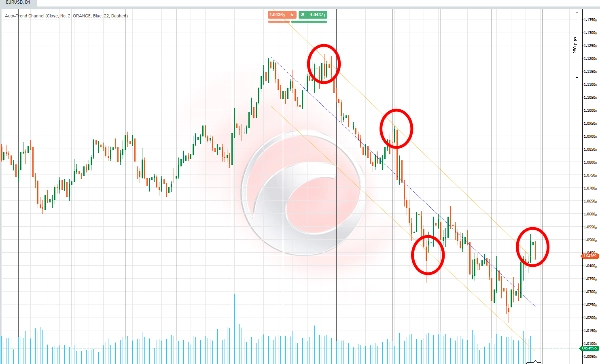
📊 Canale Auto-Trend 📊
Questo indicatore traccia un canale di tendenza basato sul calcolo della regressione lineare e della deviazione standard dei dati di prezzo (logaritmica) per un periodo selezionato automaticamente. 📈 Il periodo è determinato utilizzando il coefficiente di correlazione di Pearson (RRR), scegliendo quello con il valore assoluto più alto. 🧮
✨ Funzionalità Principale ✨
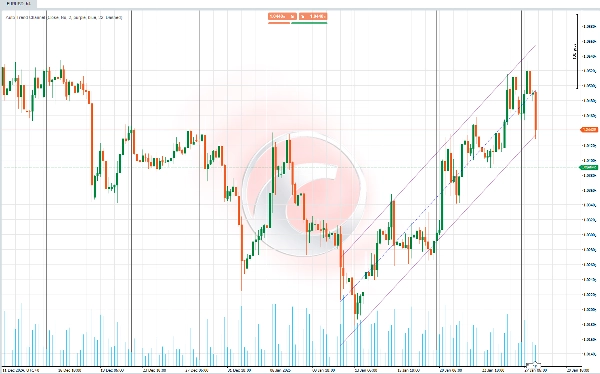
La funzionalità principale è calcolare un canale di tendenza che si adatta automaticamente alla lunghezza del periodo più rappresentativo, utilizzando statistiche avanzate per definire supporto, resistenza, e la linea centrale di tendenza.
Il canale include:
1️⃣ Una linea di base che rappresenta la tendenza lineare calcolata.
2️⃣ Linee superiore e inferiore che definiscono le bande del canale a una distanza proporzionale alla deviazione standard.
🚀 Caratteristiche e Calcoli 🚀
🔎 Calcolo del Periodo Ottimale
- L'indicatore valuta più periodi di dati (brevi o lunghi, a seconda della configurazione) per trovare quello con la correlazione più accurata al comportamento del mercato.
- Il coefficiente di correlazione di Pearson è usato come metrica chiave per identificare il periodo con la relazione più forte tra il prezzo storico e la linea di tendenza generata.
📐 Regressione Lineare e Proiezione del Prezzo
- Per ogni periodo valutato, viene calcolata una linea di regressione basata sul logaritmo naturale dei prezzi per stabilizzare variazioni estreme.
- I componenti chiave del calcolo includono:
-
- Pendenza: Rappresenta il tasso di variazione del prezzo.
- Intercetta: Il punto di partenza della linea proiettata.
- Media: Stabilisce una linea di base di riferimento.
📊 Deviazione Standard e Limiti del Canale
- Viene calcolata la deviazione standard dei prezzi rispetto alla linea di regressione.
- La banda superiore (resistenza) e la banda inferiore (supporto) sono derivate regolando la linea centrale con un moltiplicatore di deviazione standard configurabile dall'utente.
🌈 Visualizzazione del Canale di Tendenza
- Il canale è composto da tre elementi principali:
-
- Linea Centrale: Mostra la tendenza principale basata sulla linea di regressione.
- Linea Superiore: Rappresenta il limite superiore del canale (resistenza), regolato dalla deviazione standard.
- Linea Inferiore: Rappresenta il limite inferiore del canale (supporto), regolato dalla deviazione standard.
- Gli utenti possono personalizzare i colori, la trasparenza e gli stili delle linee del canale per una migliore chiarezza visiva.
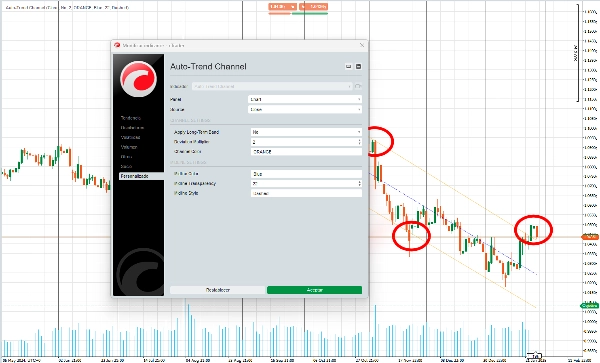
🎛️ Adattabilità e Configurazione
- Gli utenti possono personalizzare vari aspetti dell'indicatore, come:
-
- I colori delle linee e del canale.
- Se concentrarsi su periodi lunghi (tendenze macro) o periodi brevi (tendenze micro).
- Questa adattabilità garantisce che l'indicatore si adatti a diversi stili di trading e preferenze visive.
🔍 Uso :
1️⃣ Identificazione della Tendenza
- La linea centrale del canale aiuta a determinare se il mercato è in una tendenza rialzista, ribassista o in una tendenza laterale.
2️⃣ Supporto e Resistenza Dinamici
- Le linee superiore e inferiore del canale fungono da potenziali zone dove il prezzo può invertire o consolidare.
3️⃣ Rilevamento di Consolidamento e Breakout
- I prezzi che rimangono all'interno del canale suggeriscono consolidamento, mentre un breakout indica un cambio di tendenza o un forte movimento di prezzo.
4️⃣ Adattamento a Diversi Stili di Trading
- I periodi lunghi sono utili per identificare tendenze generali e prendere decisioni strategiche in timeframe più ampi.
- I periodi brevi permettono ai trader di catturare movimenti più rapidi e rispondere ai cambiamenti immediati del mercato.
Riepilogo
Key features include:
- Optimal period selection by evaluating multiple data intervals to find the strongest correlation between historical prices and the trend line.
- Calculation of slope, intercept, and mean for precise linear regression and price projection.
- Visualization of the trend channel with customizable colors, transparency, and line styles.
- Adaptability for different trading styles by allowing focus on long-term (macro) or short-term (micro) trends.
Use cases:
- Identifying market trends (uptrend, downtrend, sideways) via the central trend line.
- Detecting dynamic support and resistance zones where price may reverse or consolidate.
- Recognizing consolidation phases within the channel and breakouts signaling trend changes or strong price movements.
- Adjusting analysis to suit strategic decisions or faster market responses depending on selected period length.
This indicator supports various markets including cryptocurrencies (BTCUSD), commodities (XAUUSD), and others, providing a statistical approach to trend and channel analysis.
Recensioni dei clienti
5 | 60 % | |
4 | 20 % | |
3 | 20 % | |
2 | 0 % | |
1 | 0 % |


![Logo di "[Hamster-Coder] Price"](https://cdn.ctrader.com/image/webp/893fb641-d5b3-44d8-91fb-6a2dc6f3d309_30647)