
Side Volume Profile
Indikator
11 käufe
Version 1.0, Aug 2025
Windows, Mac
4.3
Bewertungen: 3
Seit 26/05/2025
406.45M
Gehandeltes Volumen
60.92K
Pip-Gewinn
15
Verkäufe
1.42K
Kostenlose Installationen
Beschreibung
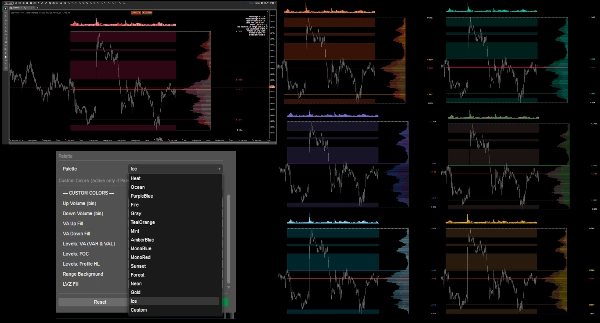
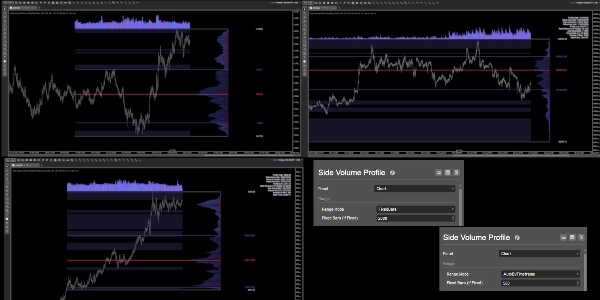
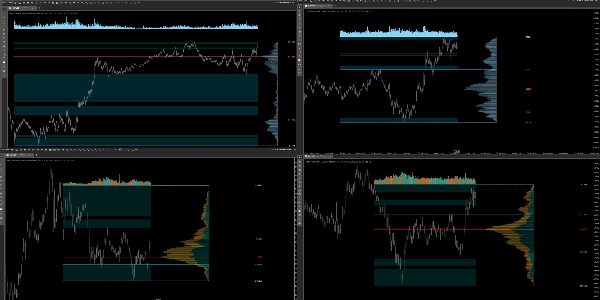
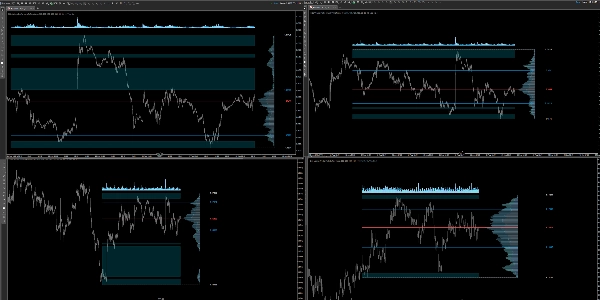
Ein rechtsseitiges Volumenprofil, das immer an den letzten Balken fixiert ist und beim Verschieben des Charts nicht springt. Es berechnet das Volumen nach Preis über einen gewählten Bereich (automatisch nach Zeitrahmen oder eine feste Balkenzahl), zeigt POC, VAH/VAL, Profilgrenzen (Hoch/Tief), hebt Zonen mit geringem Volumen (LVZ) hervor und zeichnet ein Volumenhistogramm mit EMA über dem Bereich (Versatz in Pips). Enthält ein Statistikpanel oben rechts, mehrere kontrastreiche Paletten sowie benutzerdefinierte Farben, globale Bin-Deckkraft, Breiten-/Versatzsteuerungen und Linienstärke/-stil pro Linie. Entwickelt für Lesbarkeit und Leistung.
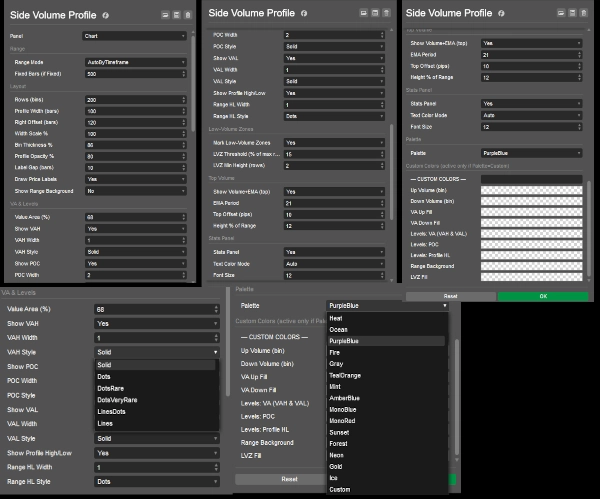
- Bereich: AutoByTimeframe oder FixedBars.
- Layout: Reihen (Bins), Profilbreite / Breitenmaßstab, rechter Versatz, Bin-Dicke, Beschriftungsabstand, Profil-Deckkraft; optionaler Bereichshintergrund.
- VA & Levels: Wertbereich %, Umschalten VAH/POC/VAL, Linienbreite & Stil pro Level; Profil Hoch/Tief.
- Zonen mit geringem Volumen: Schwellenwert (% des maximalen Reihenwerts) und Mindesthöhe (Reihen).
- Top-Volumen: EMA-Periode, Höhe (% des Bereichs), Standardversatz 10 Pips.
- Palette/Benutzerdefiniert: Wähle ein Thema oder setze eigene Farben (VAH = VAL).
- Statistikpanel: Umschalten, Schriftgröße
Dokumentation des Indikators
Zusammenfassung
KI-Zusammenfassung
Side Volume Profile is a right-anchored volume profile indicator designed for cTrader that displays volume-by-price data over a selectable range, either automatically by timeframe or a fixed number of bars. It visualizes key volume levels including Point of Control (POC), Value Area High (VAH), Value Area Low (VAL), and profile bounds (high/low). The indicator highlights low-volume zones (LVZ) based on configurable thresholds and minimum heights. It also features a volume histogram with an exponential moving average (EMA) offset in pips above the profile range.
Users can customize the layout with controls for row bins, profile width and scale, right offset, bin thickness, label gaps, and opacity. Line widths and styles for VAH, POC, VAL, and profile bounds are adjustable. Multiple high-contrast color palettes and custom color options are available. A toggleable top-right statistics panel provides summary data with adjustable font size.
The indicator supports various markets including Forex, indices, commodities, cryptocurrencies, and stocks, with tags referencing symbols like BTCUSD, EURUSD, GBPUSD, XAUUSD, NAS100, and USDJPY. It is built for readability and performance, maintaining a stable position on the chart without shifting when panning.
Indikatorprofil
Kundenbewertungen
4.3
Bewertungen: 3
5 | 33 % | |
4 | 67 % | |
3 | 0 % | |
2 | 0 % | |
1 | 0 % |
Kundenbewertungen
Diskussion
Häufig gestellte Fragen (FAQ)
BTCUSD
Forex
Indices
EURUSD
Commodities
GBPUSD
NZDUSD
Prop
Fair Value Gap
SMC
Crypto
Stocks
XAUUSD
NAS100
USDJPY
VWAP
Über den cTrader Store verfügbare Produkte, einschließlich Handelsbots, Indikatoren und Plugins, werden von externen Entwicklern bereitgestellt und nur zu Informations- und technischen Zugriffszwecken verfügbar gemacht. cTrader Store ist kein Broker und erbringt keine Anlageberatung, persönlichen Empfehlungen oder eine Garantie für zukünftige Performance.
Mehr von diesem Autor


Preis
Seit 26/05/2025
406.45M
Gehandeltes Volumen
60.92K
Pip-Gewinn
15
Verkäufe
1.42K
Kostenlose Installationen