
Market Entropy
Indikator
107 downloads
Version 1.0, Aug 2025
Windows, Mac
Seit 26/05/2025
388.58M
Gehandeltes Volumen
60.75K
Pip-Gewinn
15
Verkäufe
1.41K
Kostenlose Installationen
Beschreibung
Market Entropy ist ein dualer Indikator (Oszillator + optionales Preis-Overlay), der die Marktorganisation quantifiziert und Regimewechsel über Ordnung → Übergang → Chaos anzeigt. Er fügt eine zweite Linie hinzu, Trendness (DC), um echten Trend von Volatilitätsengpass zu trennen.
Wie es funktioniert:
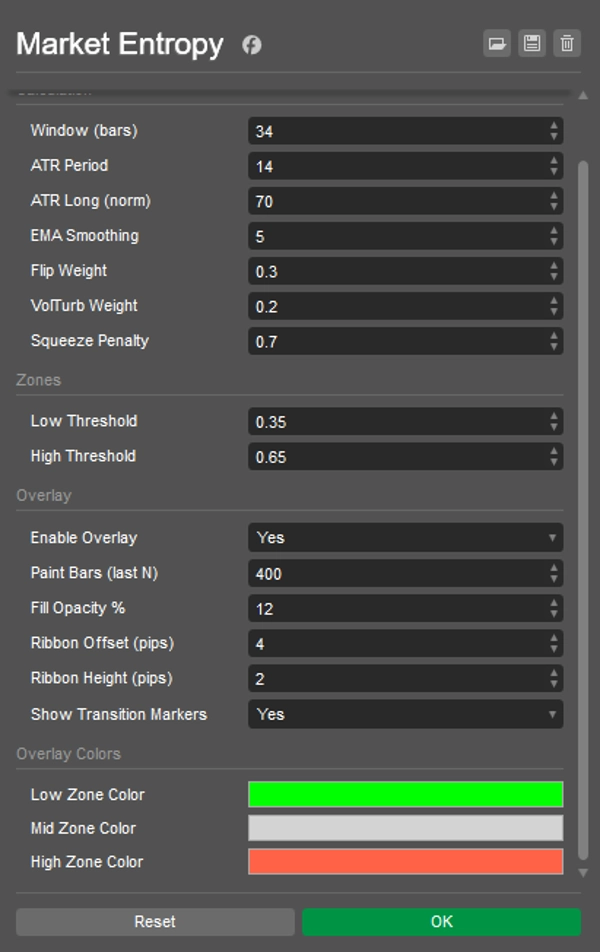
- Verwendet nur OHLCV-Komponenten: DC (Richtungskonsistenz), FlipRate (Vorzeichenwechsel), Volatility_n (ATR/ATRlong), VolumeTurb (Standardabweichung von ΔVolumen).
- Rohentropie:
E0 = 0.5*(1-DC) + 0.3*(FlipRate*VolN) + 0.2*VolumeTurb). - Anti-Squeeze-Term senkt E während ATR-Kompressionen → finale Entropie ∈ [0..1] mit EMA-Glättung.
- Marker:
-
- CRYSTAL — Kreuzung unter LowThr (Ordnung entsteht: Trend oder Vorbruch-Engpass).
- DISSOLVE — Kreuzung über HighThr (Ordnung bricht zusammen: Chaos/Trendverfall).
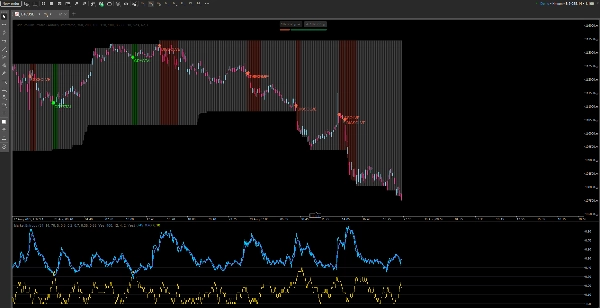
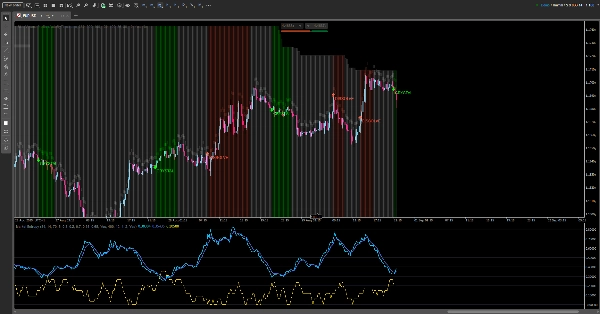
Was Sie sehen:
- Im Panel: Entropie, Entropie(EMA), Trendness (DC), Low/High-Schwellenwerte, Zonenhintergrund.
- Im Chart (umschaltbar): zustandsfarbige Balken, ein schlankes Band über Hochs und CRYSTAL/DISSOLVE-Marker.
Leseanleitung:
- E < LowThr → Ordnung:
-
- mit hohem DC → organisierter Trend;
- mit niedrigem ATR → Engpass (Bruch erwartet).
- LowThr…HighThr → Übergang: Struktur bildet sich; auf Auflösung warten.
- E > HighThr → Chaos: Unsicherheit / Trendverschleiß; naive Fortsetzungseinträge vermeiden.
Spielanleitungen:
- Engpass → CRYSTAL → Bruch/Retest — den Ausbruch handeln.
- Trend → DISSOLVE — Teilverkauf oder Risiko reduzieren.
Zusammenfassung
Indikatorprofil
Kundenbewertungen
0.0
Bewertungen: 0
Kundenbewertungen
Bisher gibt es keine Bewertungen für dieses Produkt. Haben Sie es schon ausprobiert? Dann können Sie die erste Person sein, die andere darüber informiert!
Diskussion
Häufig gestellte Fragen (FAQ)
Über den cTrader Store verfügbare Produkte, einschließlich Handelsbots, Indikatoren und Plugins, werden von externen Entwicklern bereitgestellt und nur zu Informations- und technischen Zugriffszwecken verfügbar gemacht. cTrader Store ist kein Broker und erbringt keine Anlageberatung, persönlichen Empfehlungen oder eine Garantie für zukünftige Performance.


Preis
Seit 26/05/2025
388.58M
Gehandeltes Volumen
60.75K
Pip-Gewinn
15
Verkäufe
1.41K
Kostenlose Installationen