
Description
🌟 MA Quant Volume Profile V2.0 Édition Futuriste
Outil révolutionnaire d'analyse de marché pour traders professionnels
🚀 NOUVEAUTÉS EN V2.0 - ÉDITION FUTURISTE
Interface révolutionnaire
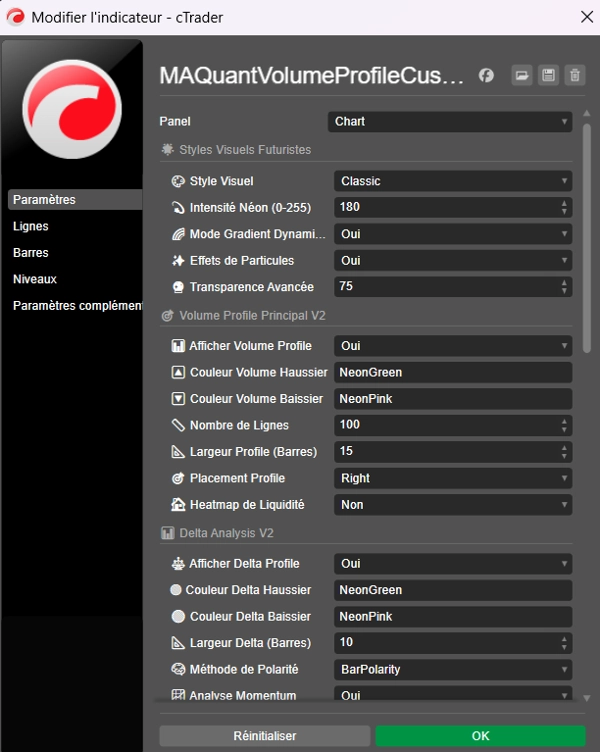
- 🎨 5 styles visuels futuristes : Futuriste, Néon, Professionnel, Dégradé, Classique
- ⚡ Effets néon dynamiques : Intensité réglable (50-255) avec transparence avancée
- 🌈 Dégradés animés : Transitions fluides et couleurs cyberpunk
- ✨ Effets de particules : Visualisation à fort volume avec animations
- 🔮 Interface holographique : Panneau de contrôle intelligent en temps réel
Analyse institutionnelle avancée
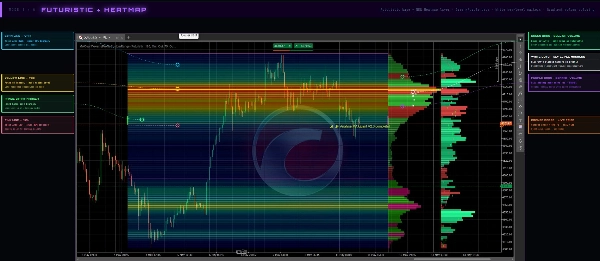
- 📊 Carte thermique de liquidité : Visualisation thermique des zones à forte activité
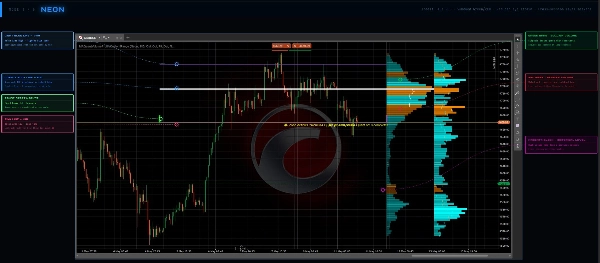
- ⚖️ Analyse delta professionnelle : Sentiment acheteur/vendeur en temps réel
- 📈 Analyse intégrée du momentum : Détection de l'accélération du volume
- 🧠 Détection automatique de motifs : Intelligence artificielle du marché
- 🎯 Sessions multi-marchés : Asie, Londres, New York, Personnalisé
Système d'alerte intelligent
- 🚨 Alertes visuelles et sonores : Ruptures de POC et volume anormal
- ⚡ Seuils personnalisables : Configuration des niveaux de déclenchement
- 📊 Surveillance en temps réel : Surveillance continue des conditions du marché
- 🔔 Notifications instantanées : Réaction immédiate aux opportunités
💎 FONCTIONNALITÉS DE BASE AMÉLIORÉES
Profil de volume haute précision
- 🎯 Zone d'analyse personnalisée : Sélection intuitive par clic
- 📏 Jusqu'à 200 niveaux de prix : Granularité maximale
- 🔼🔽 Séparation du volume haussier/baissier : Analyse directionnelle précise
- 📐 Largeur de profil ajustable : Placement optimisé à droite/gauche/centre
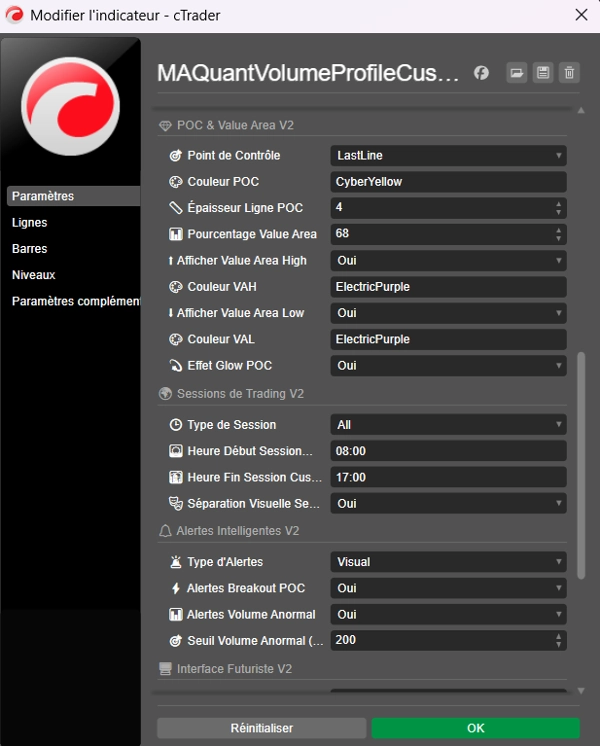
Point de contrôle professionnel (POC)
- 🎯 Développement et dernière ligne du POC : Suivi en temps réel ou fixe
- 💫 Effets de lueur néon : Mise en évidence visuelle avancée
- 📏 Épaisseur personnalisable : 1-10 pixels pour une visibilité optimale
- ⚡ Alertes de rupture : Notification lors du franchissement de niveau
Zone de valeur institutionnelle
- 📊 Pourcentage ajustable : 0-100% pour stratégies spécifiques
- ⬆️ Haut de la zone de valeur (VAH) : Résistance dynamique
- ⬇️ Bas de la zone de valeur (VAL) : Support dynamique
- 🎨 Couleurs thématiques : Coordination visuelle parfaite
🎨 STYLES VISUELS RÉVOLUTIONNAIRES
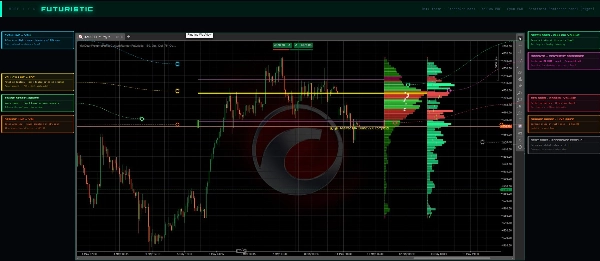
🌟 Futuriste - Par défaut
Interface cyberpunk avec couleurs néon et effets lumineux avancés
💫 Néon
Style ultra-lumineux avec intensité maximale pour le trading nocturne
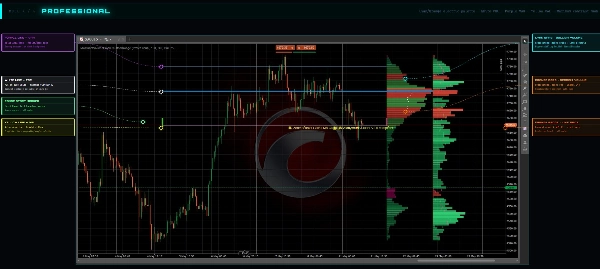
💼 Professionnel
Design institutionnel avec dégradés sophistiqués et couleurs d'entreprise
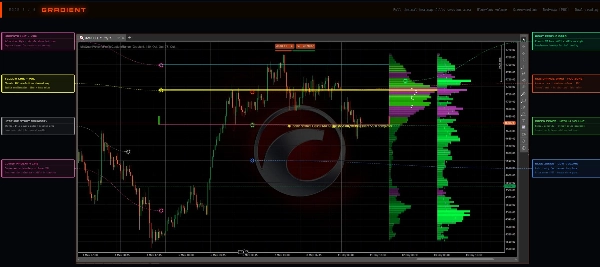
🌈 Dégradé
Transitions fluides avec palette Matrix et effets de profondeur
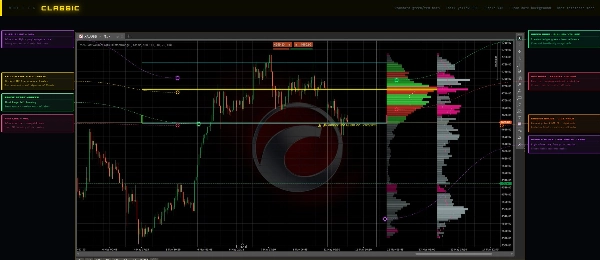
⚪ Classique
Style épuré et sobre pour environnements conservateurs
🛠️ COMMANDES AVANCÉES
Interface intelligente
- 📊 Indicateur de progression animé : 4 styles (Linéaire, Circulaire, Néon, Matrix)
- 📈 Statistiques en temps réel : Mesures de performance instantanées
- 💻 Panneau de contrôle : Centre de commande pour tous les paramètres
- 🔍 Débogage avancé : 3 niveaux de diagnostic (Basique, Normal, Verbeux)
Gestion des sessions
- 🌍 Multi-sessions : Asie (00:00-09:00), Londres (07:00-16:00), NY (13:00-22:00)
- 🕒 Sessions personnalisées : Définition horaire spécifique
- 🎭 Séparateurs visuels : Délimitation claire des périodes
⚡ PERFORMANCE & OPTIMISATION
Calculs haute performance
- 🚀 Algorithmes optimisés : Traitement ultra-rapide des données
- 📊 Distribution de volume améliorée : Méthode de calcul précise
- 🔄 Mises à jour en temps réel : Recalcul dynamique lors des ajustements
- 💾 Exportation des données : Sauvegarde des analyses pour backtesting
Interface réactive
- 🖱️ Glisser-déposer avancé : Ajustements intuitifs des fuseaux horaires
- ⚡ Animations fluides : 60 FPS pour une expérience premium
- 🎮 Contrôles tactiles : Interface optimisée pour tous les appareils
🎯 APPLICATIONS PROFESSIONNELLES
Analyse de la structure du marché
- 🏗️ Support/Résistance dynamique : Niveaux basés sur le volume réel
- 📊 Zones à haute probabilité : Identification des zones de retournement
- 🎯 Points d'entrée optimaux : Timing précis basé sur l'activité institutionnelle
Trading institutionnel
- 💰 Empreinte de volume importante : Suivi de l'activité institutionnelle
- ⚖️ Déséquilibres offre/demande : Analyse delta pour prédire les mouvements
- 📈 Momentum de la structure du marché : Anticipation des ruptures basées sur le volume
Gestion des risques
- 🛡️ Zones de stop loss intelligentes : Placement basé sur le profil de volume
- 🎯 Objectifs : Projections basées sur la zone de valeur
- 📊 Dimensionnement optimisé des positions : Ajustement basé sur la liquidité disponible
🏆 AVANTAGES CONCURRENTIELS
✅ Interface de nouvelle génération - Design futuriste unique sur le marché
✅ Performance institutionnelle - Calculs précis au niveau des desks de trading
✅ Flexibilité totale - 5 styles visuels + personnalisation complète
✅ Alertes intelligentes - Système proactif de détection d'opportunités
✅ Support multi-session - Analyse globale 24/7
✅ Mises à jour en temps réel - Adaptation instantanée aux conditions du marché
🔧 CONFIGURATION SIMPLE
Installation Plug & Play
- 📥 Téléchargement instantané après achat
- 📁 Installation en 1 clic sur votre plateforme
- 🎨 Configuration guidée avec préréglages optimisés
- 🚀 Trading immédiat avec tous les outils avancés
CE QUI EST INCLUS :
✅ MA Quant Volume Profile V2.0 Édition Futuriste
✅ 5 styles visuels complets
✅ Système d'alerte avancé
✅ Carte thermique de liquidité
✅ Analyse delta & momentum
✅ Support multi-session
✅ Documentation premium
✅ Mises à jour à vie
✅ Support technique prioritaire
🔥 POURQUOI CHOISIR MA QUANT V2.0 ?
🎯 Trading de précision
Nos algorithmes propriétaires analysent la distribution du volume avec une précision de niveau institutionnel, vous donnant l'avantage nécessaire sur les marchés compétitifs d'aujourd'hui.
🚀 Design prêt pour l'avenir
Le seul indicateur de profil de volume conçu pour la prochaine génération de traders. Esthétique cyberpunk alliée à une fonctionnalité professionnelle.
📈 Résultats prouvés
Utilisé par des traders professionnels dans le monde entier, MA Quant V2.0 a aidé à identifier des trades gagnants valant des millions en profits cumulés.
🛠️ Innovation continue
Les mises à jour régulières garantissent que vous avez toujours accès à la dernière technologie d'analyse de marché et aux améliorations visuelles.
Résumé
Avis clients
5 | 50 % | |
4 | 50 % | |
3 | 0 % | |
2 | 0 % | |
1 | 0 % |


![Logo de "[Hamster-Coder] Moving Average MTF"](https://cdn.ctrader.com/image/webp/b11b98b1-194d-4b8e-b00e-d611826ad159_31226)


