
Beschreibung
https://chartshots.spotware.com/c/695be69b1a3ca
https://chartshots.spotware.com/c/695be2a98e848
https://chartshots.spotware.com/c/695be7e8e88fa
https://chartshots.spotware.com/c/695be31346fe7
https://chartshots.spotware.com/c/695be3bd18aea
https://chartshots.spotware.com/c/695be5d5687c7
Auto Chart Patterns
📊 WAS IST DAS?
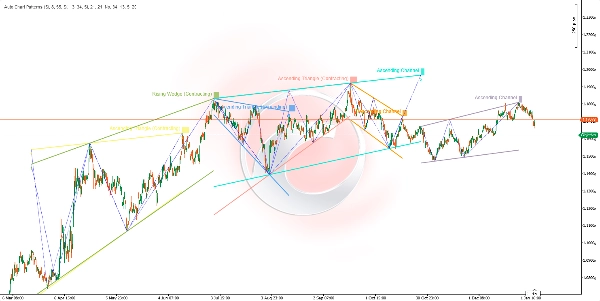
Der Auto Chart Patterns Indikator ist ein fortschrittlicher Scanner für geometrische Formationen, der automatisch klassische Chartmuster erkennt und visualisiert, indem er eine Multi-Timeframe-Swing-Punkt-Analyse verwendet. Er identifiziert 14 verschiedene geometrische Formationen einschließlich Kanälen, Keilen und Dreiecken, indem er Swing-Hochs und -Tiefs mit Trendlinien verbindet und so ein umfassendes Mustererkennungssystem schafft.
🎯 WOFÜR IST ES?
Dieser Indikator hilft Tradern dabei:
- Automatisch 14 klassische Chartmuster (Kanäle, Keile, Dreiecke) 📐 zu erkennen
- Potenzielle Ausbruchsbereiche zu identifizieren bevor sie auftreten ⚡
- Die Marktstruktur durch geometrische Preisbeziehungen zu visualisieren 🔍
- Fortsetzungs- und Umkehrmuster mit visueller Bestätigung zu handeln ✅
- Muster nach Trendrichtung und finalem Pivot-Typ zu filtern 🎛️
- Mehrere Swing-Timeframes gleichzeitig zu analysieren für Konfluenz 🌊
🔍 WIE FUNKTIONIERT ES?
Swing-Punkt-Erkennungssystem 📍
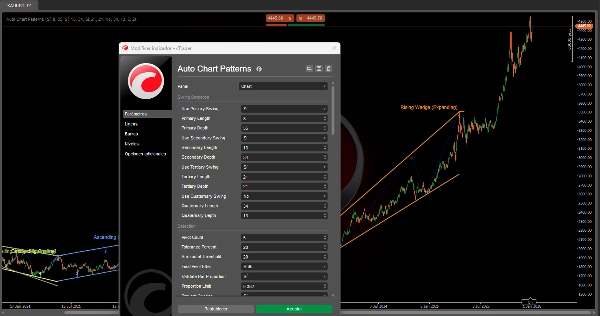
Der Indikator verwendet bis zu vier unabhängige Swing-Detektoren die gleichzeitig laufen, jeder mit konfigurierbarer Empfindlichkeit:
- Erkennungslogik:
-
- Überwacht Preis-Hochs und -Tiefs über ein rollierendes Fenster (Periode).
- Identifiziert lokale Spitzen (Swing-Hochs) und Täler (Swing-Tiefs).
- Bestätigt Swings erst nach Erfüllung einer Mindesttiefe (verhindert Rauschen).
- Swing High: Der Preis erreicht das höchste Hoch in der Periode und fällt dann für
MinDepthKerzen. - Swing Low: Der Preis erreicht das niedrigste Tief in der Periode und steigt dann für
MinDepthKerzen.
- Vier Swing-Ebenen:
-
- Primärer Swing (Standard: Länge 8, Tiefe 55) - Langfristige Struktur 🔵
- Sekundärer Swing (Standard: Länge 13, Tiefe 34) - Mittelfristige Struktur 🟢
- Tertiärer Swing (Standard: Länge 21, Tiefe 21) - Kurzfristige Struktur 🟡
- Quartärer Swing (Standard: Deaktiviert) - Benutzerdefinierter Zeitrahmen 🟣
Jeder Detektor kann unabhängig ein- oder ausgeschaltet werden, um sich auf bestimmte Marktstrukturen zu konzentrieren.
Musterbildungsprozess 🎨
SCHRITT 1 - PIVOT-SAMMLUNG:
- Das System sammelt die 5 oder 6 neuesten Swing-Punkte von jedem aktiven Detektor.
- Punkte müssen sich zwischen Hochs und Tiefs abwechseln (Zickzack-Struktur).
- Beispiel 5-Punkte: Hoch → Tief → Hoch → Tief → Hoch.
SCHRITT 2 - TRENDLINIEN-KONSTRUKTION:
- Trennt Pivots in obere Punkte (Swing-Hochs) und untere Punkte (Swing-Tiefs).
- Zeichnet zwei Trendlinien: obere Grenze und untere Grenze.
- Für 3-Punkt-Grenzen: Testet 3 Kombinationen (0-2, 0-1, 1-2) und wählt die beste Passform ⭐
- Validiert, dass Trendlinien nicht in Kerzenkörper eindringen (nur Dochte erlaubt).
- Berechnet eine Passformbewertung: Linien müssen < 20% der Kerzen zwischen den Pivots berühren.
SCHRITT 3 - GEOMETRISCHE ANALYSE:
- Misst den Winkelbezug zwischen der oberen und unteren Grenze.
- Bestimmt, ob die Formation expandierend (sich verbreiternd), kontrahierend (sich verengend) oder parallel (konstante Breite) ist.
- Identifiziert die Trendrichtung: Aufwärts, Abwärts oder Neutral (horizontal).
- Klassifiziert in einen der 14 Formationstypen basierend auf der Geometrie.
SCHRITT 4 - VALIDIERUNG & FILTERUNG:
- Kerzenproportionsprüfung: Stellt sicher, dass die Swing-Abstände proportional sind (verhindert verzerrte Muster) ✅
- Überlappungsvermeidung: Blockiert neue Muster, die mit bestehenden in Konflikt stehen 🚫
- Duplikatprüfung: Verhindert das Neuzeichnen desselben Musters.
- Finaler Pivot-Filter: Zeigt nur Muster, die mit einer bestimmten Pivot-Richtung enden (Auf/Ab/Beide).
- Formationstyp-Filter: Aktiviert/deaktiviert bestimmte Musterkategorien.
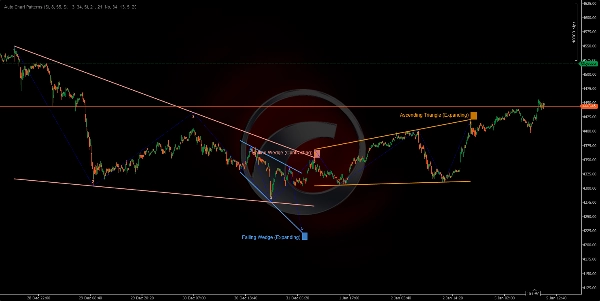
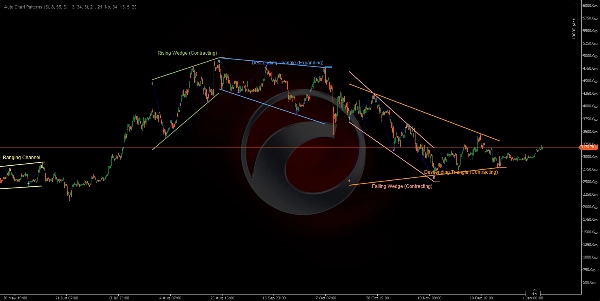
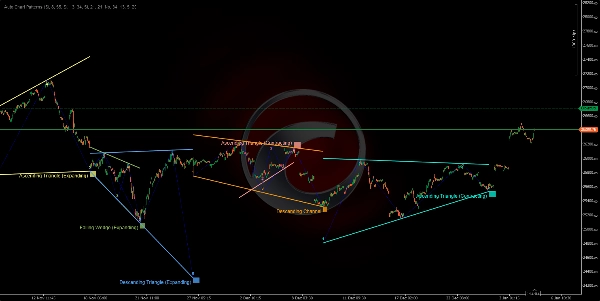
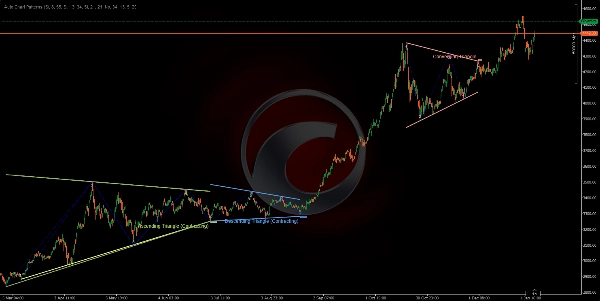
SCHRITT 5 - VISUALISIERUNG:
- Zeichnet obere und untere Begrenzungslinien in lebendigen Farben aus einer 12-Farben-Palette 🎨
- Zeigt optional Zickzack-Swing-Linien, die Pivots verbinden (gepunktet blau).
- Zeigt Pivot-Nummern (1, 2, 3, 4, 5) an jedem Swing-Punkt.
- Beschriftet die Formation mit dem Musternamen am finalen Pivot.
- Färbt den Hintergrund hinter dem Label zur besseren Übersicht ein.
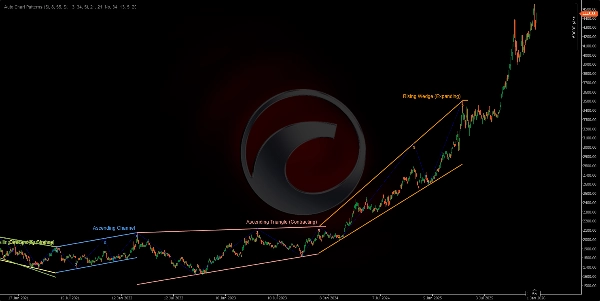
📐 DIE 14 ERKANNTEN FORMATIONEN
KANÄLE (Parallele Formationen) 📦
- Aufsteigender Kanal (Aufwärts Parallel) 📈
-
- Beide Begrenzungen steigen in einem ähnlichen Winkel an.
- Zeigt einen bullischen Fortsetzungstrend an.
- Handel: Kauf an der unteren Begrenzung, Verkauf an der oberen Begrenzung.
- Absteigender Kanal (Abwärts Parallel) 📉
-
- Beide Begrenzungen fallen in einem ähnlichen Winkel ab.
- Zeigt einen bärischen Fortsetzungstrend an.
- Handel: Verkauf an der oberen Begrenzung, Kauf an der unteren Begrenzung.
- Seitwärtskanal (Lateral/Horizontal) ↔️
-
- Beide Begrenzungen sind nahezu horizontal.
- Zeigt Konsolidierung oder Unentschlossenheit an.
- Handel: Range-gebundene Strategie, Kauf bei Unterstützung/Verkauf bei Widerstand.
EXPANDIERENDE KEILE (Spreizende Formationen) 📣
4. Steigender Keil (Expandierend) ⚠️
* Beide Begrenzungen steigen an, mit einer sich verbreiternden Lücke.
* Bärisches Umkehrmuster - Preis verliert Aufwärtsdynamik.
* Handel: Warten auf Bruch der unteren Begrenzung, Short eingehen.
5. Fallender Keil (Expandierend) ⚠️
* Beide Begrenzungen fallen ab, mit einer sich verbreiternden Lücke.
* Bullishes Umkehrmuster - Preis verliert Abwärtsdynamik.
* Handel: Warten auf Bruch der oberen Begrenzung, Long eingehen.
6. Divergierendes Dreieck (Spreizendes Dreieck) 🔺
* Obere Begrenzung steigt, untere Begrenzung fällt.
* Hochvolatiles Expansionsmuster.
* Handel: Extrem riskant, auf klaren Richtungsbruch warten.
7. Aufsteigendes Dreieck (Expandierend) 📊
* Obere Begrenzung horizontal, untere Begrenzung steigt.
* Bullische Fortsetzung mit sich ausdehnender Spanne.
* Handel: Kauf bei Ausbruch der oberen Begrenzung.
8. Absteigendes Dreieck (Expandierend) 📊
* Untere Begrenzung horizontal, obere Begrenzung fällt.
* Bärische Fortsetzung mit sich ausdehnender Spanne.
* Handel: Verkauf bei Durchbruch der unteren Begrenzung.
KONTRAHIERENDE KEILE (Konvergierende Formationen) 🔻
9. Steigender Keil (Kontrahierend) 🔺
* Beide Begrenzungen steigen an, mit einer sich verengenden Lücke.
* Bärisches Umkehrmuster - bullische Erschöpfung ⚠️
* Handel: Short bei Bruch der unteren Begrenzung.
10. Fallender Keil (Kontrahierend) 🔻
* Beide Begrenzungen fallen ab, mit einer sich verengenden Lücke.
* Bullishes Umkehrmuster - bärische Erschöpfung ⚠️
* Handel: Long bei Bruch der oberen Begrenzung.
KONTRAHIERENDE DREIECKE (Konsolidierungsformationen) △
11. Konvergierendes Dreieck (Symmetrisches Dreieck) ⚖️
* Obere Begrenzung fällt, untere Begrenzung steigt in ähnlichem Maße.
* Neutrale Konsolidierung - Fortsetzungsmuster.
* Handel: Auf Ausbruchsrichtung warten, entsprechend handeln.
12. Absteigendes Dreieck (Kontrahierend) 📐
* Untere Begrenzung horizontal (Unterstützung), obere Begrenzung fällt.
* Bärisches Fortsetzungsmuster 🔴
* Handel: Short bei Unterstützungsbruch mit Volumen.
13. Aufsteigendes Dreieck (Kontrahierend) 📐
* Obere Begrenzung horizontal (Widerstand), untere Begrenzung steigt.
* Bullishes Fortsetzungsmuster 🟢
* Handel: Long bei Widerstandsdurchbruch mit Volumen.
14. Ungültig/Unbekannt ❌
* Muster, die die geometrischen Kriterien nicht erfüllen.
* Werden automatisch herausgefiltert.
Zusammenfassung
Key functionalities include identifying potential breakout zones, visualizing market structure through geometric price relationships, and supporting trading of continuation and reversal patterns with visual confirmation. Users can filter detected patterns by trend direction, pivot type, and formation category. The indicator prevents overlapping and duplicate patterns to maintain clarity.
The 14 detected formations cover a range of classical patterns such as ascending, descending, and ranging channels; expanding and contracting wedges; and various triangle types (converging, diverging, ascending, descending). Visual outputs include color-coded boundary lines, pivot numbering, zigzag swing lines, and labeled pattern names for easy interpretation. This tool supports analysis across multiple markets including Forex, stocks, commodities, indices, and cryptocurrencies.
Kundenbewertungen
5 | 50 % | |
4 | 50 % | |
3 | 0 % | |
2 | 0 % | |
1 | 0 % |


