
Beschreibung
🚀 Über 10.000 Trader nutzen bereits unsere TOP Indikatoren🏆
Entdecken Sie, warum Profis uns wählen – die leistungsstärksten Tools auf cTrader (Indikatoren, Algorithmen und cBots) warten auf Sie.
👉 Holen Sie sich hier alle unsere TOP-Systeme:
_______________________________________________
📌 Marktstruktur-Indikatoren
· ✅ AdvancedMarket Structure: Bos, Choch, SwinLevels, Order Blocks, Marktstruktur& Liquidity Finder
· 🔄 Dynamische Marktstrukturanalyse von Wendepunkten
· 🧱 Order Block
· ⚖️ Marktungleichgewicht
· ⛓️ BOS & CHOCH
· 🧠 ICT Power of 3
_______________________________________________
🔚 Intelligente Ausstiegssysteme
_______________________________________________
📐 ZigZag-Indikatoren
· 🔍 ZigZag Preis-Liquiditätsprojektion
· ➖ ZigZag
_______________________________________________
🧱 Support- & Resistance-Indikatoren
· 🟩 SmartTrend Support- & Resistance-Linien
· 🧱 Alle Support- und Resistance-Level
_______________________________________________
📊 Trend- & Kanalindikatoren
· 🔄 Auto-Trend-Kanal
· 📊 Supertrend
_______________________________________________
💧 Volumen- & Liquiditäts-Tools
_______________________________________________
⚡ Momentum- & RSI-Indikatoren
· 🚀 Dynamisches Range Momentum
· 🔎 Multi-Level Candle Bias
Tracker
_______________________________________________
🔮 Prognose- & Projektions-Tools
· 📐 Prognose basierend auf Linreg & ATR
· 📏 Fibonacci Lineare Regression Multi-Timeframe
· 📈 Volumengetriebener Market Flow Projector
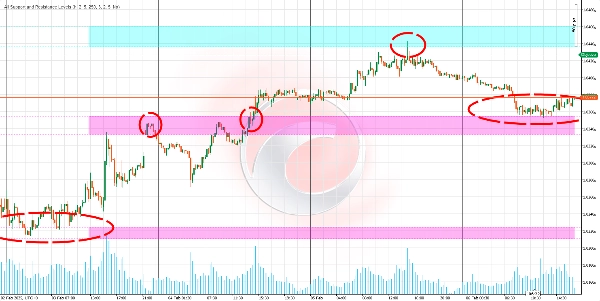
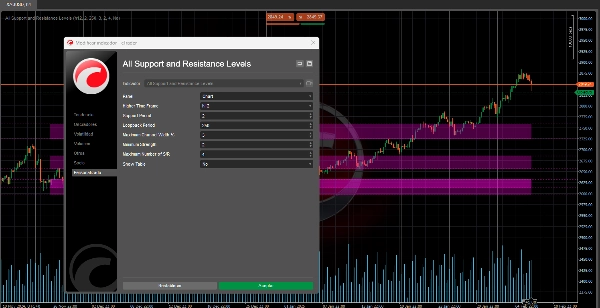
Dieser Algorithmus ist ein fortschrittlicher Support- und Resistance-Indikator, der Ihnen hilft, wichtige Marktlevel zu identifizieren.
Sein Hauptvorteil ist, dass er Ihnen ermöglicht, Support- und Resistance-Level aus jedem Zeitrahmen (wie täglich, wöchentlich oder monatlich) direkt auf dem Chart anzuzeigen, den Sie analysieren, selbst wenn dieser in einem anderen Zeitrahmen ist (z. B. 15 Minuten oder 1 Stunde). 📊⏰
Wozu dient das? 🎯
Identifizieren Sie wichtige Marktbereiche:
- Erkennen Sie Level, an denen der Preis stoppen, abprallen oder mit Stärke durchbrechen könnte. 🛑↗️↘️
- Hilft Ihnen, fundiertere Entscheidungen zu Ein- und Ausstiegen sowie Stop-Losses zu treffen. 💡📈📉
Analysieren Sie mehrere Zeitrahmen ohne Chartwechsel:
- Sehen Sie wichtige Level aus höheren Zeitrahmen (wie täglich oder wöchentlich), während Sie auf niedrigeren Zeitrahmen (wie 15 Minuten oder 1 Stunde) handeln. 🕒📅
- Bietet Ihnen eine breitere Marktübersicht, ohne ständig die Charts wechseln zu müssen. 🌍🔍
Priorisieren Sie bedeutende Level:
- Der Indikator bewertet Support- und Resistance-Level basierend auf ihrer "Stärke", also wie oft der Preis in der Vergangenheit mit ihnen interagiert hat. 💪📊
- Dies hilft Ihnen, sich auf die relevantesten und zuverlässigsten Level zu konzentrieren. 🎯✅
Wie funktioniert die Logik? 🧠⚙️
Datenerfassung:
- Der Indikator nimmt die Hoch- und Tiefpreise eines bestimmten Zeitrahmens (täglich, wöchentlich usw.). 📈📉
- Diese Daten werden verwendet, um nach Schlüsselmustern im Preisverhalten zu suchen. 🔍📊
Erkennung von Schlüsselpunkten (Pivots):
- Er identifiziert lokale Hoch- und Tiefpunkte – Stellen, an denen der Preis im Vergleich zu benachbarten Preisen ein Maximum oder Minimum erreicht hat. ⛰️🌄
- Diese Punkte sind Kandidaten, um Support- oder Resistance-Level zu werden. 🎯📌
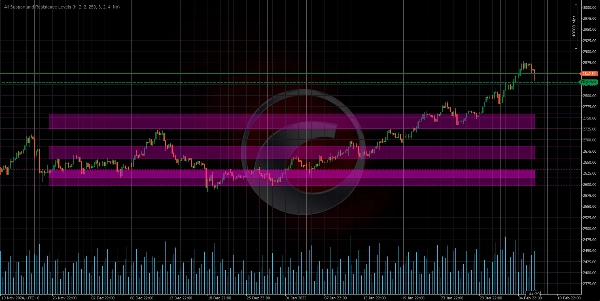
Gruppierung von Leveln:
- Nahe beieinanderliegende Level werden gruppiert, um Support- oder Resistance-Zonen zu bilden, anstatt exakte Linien. 🟦🟧
- Dies spiegelt die Idee wider, dass Support und Resistance Bereiche und keine genauen Punkte sind. 📏🎯
Berechnung der Levelstärke:
Die "Stärke" eines Levels wird durch zwei Faktoren bestimmt:
- Häufigkeit der Berührungen: Wie oft der Preis dieses Level in der Vergangenheit berührt oder sich ihm genähert hat. 🔄📊
- Clusterbildung von Schlüsselpunkten: Wie viele Hoch- oder Tiefpunkte sich in der Nähe dieses Levels befinden. 🔗📈
Level mit größerer Stärke gelten als bedeutender. 💪🎯
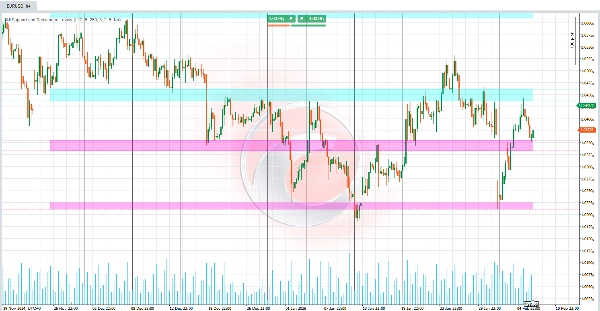
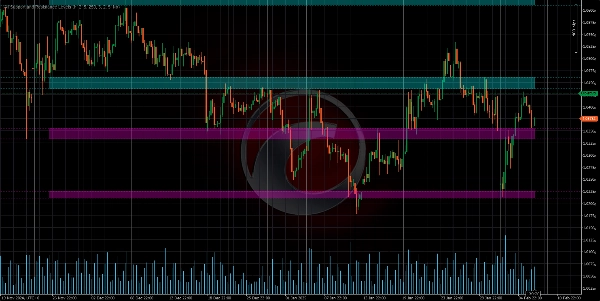
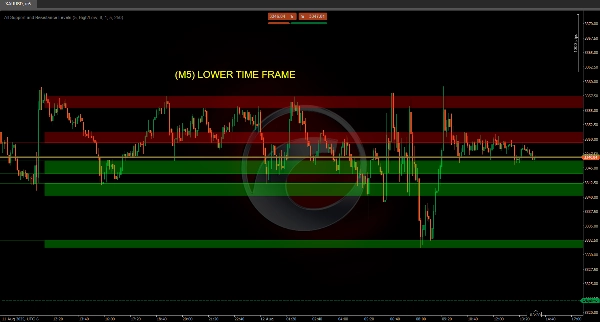
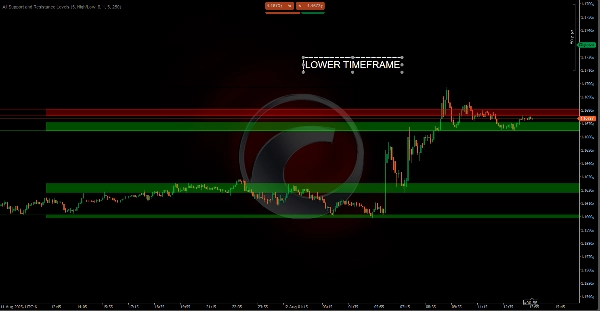
Chart-Visualisierung:
- Level werden als horizontale Linien oder farbige Zonen im Chart dargestellt. 🎨📊
- Die Farbe jedes Levels hängt von der aktuellen Preisposition ab:
-
- Resistance: Wenn der Preis unter dem Level liegt. 🔴
- Support: Wenn der Preis über dem Level liegt. 🟢
- Innerhalb der Range: Wenn der Preis innerhalb des Bereichs des Levels liegt. 🟡
Wie können Sie verschiedene Zeitrahmen in Ihrem Chart anzeigen? 🕒📊
Support und Resistance aus höheren Zeitrahmen auf niedrigeren Zeitrahmen-Charts:
- Zum Beispiel, wenn Sie einen 15-Minuten-Chart analysieren, kann der Indikator wichtige Level aus dem täglichen oder wöchentlichen Zeitrahmen anzeigen. 🕒📅
- So sehen Sie wichtige Level mit höherem Kontext, ohne Ihren aktuellen Chart zu verlassen. 🌍🔍
Support und Resistance aus niedrigeren Zeitrahmen auf höheren Zeitrahmen-Charts:
- Obwohl seltener, können Sie auch Level aus kleineren Zeitrahmen (wie 1-Minuten- oder 5-Minuten-Charts) auf höheren Zeitrahmen (wie täglich oder wöchentlich) anzeigen. 🕒📅
- Dies kann für detailliertere Analysen innerhalb eines breiteren Kontexts nützlich sein. 🔍📊
Zusammenfassung
The indicator analyzes price data by collecting highs and lows from specified timeframes, identifying local pivot points where price peaks or valleys occur. These points are grouped into zones representing support or resistance areas rather than precise lines. Each level is assigned a strength score based on the frequency of price touches and the clustering of key points, helping users prioritize the most significant and reliable levels.
Visualized on the chart as horizontal lines or colored zones, the indicator uses color coding to indicate the price's position relative to each level: red for resistance (price below level), green for support (price above level), and yellow when price is within the level’s range. This tool assists traders in making informed decisions on entries, exits, and stop-loss placements by highlighting where price may stop, bounce, or break with strength.
Kundenbewertungen
5 | 50 % | |
4 | 0 % | |
3 | 0 % | |
2 | 0 % | |
1 | 50 % |


![„[Hamster-Coder] Bollinger Bands“-Logo](https://cdn.ctrader.com/image/webp/21d8e5d6-fb11-4bac-b9ee-cd05c2b76804_30327)


