
VolumeThermometer
Indicateur
426 téléchargements
Version 1.0, Aug 2025
Windows, Mac
Depuis le 26/05/2025
451.48M
Volume tradé
61.16K
Pips gagnés
15
Ventes
1.43K
Installations gratuites
Description
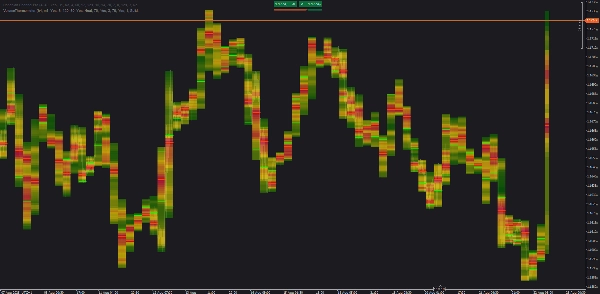
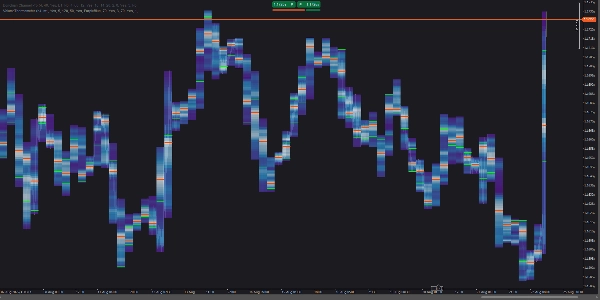
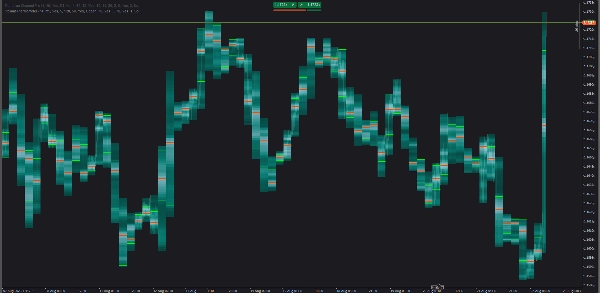
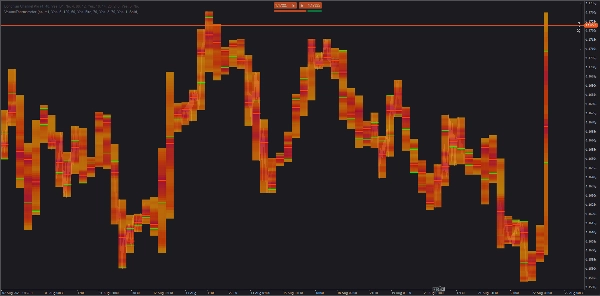
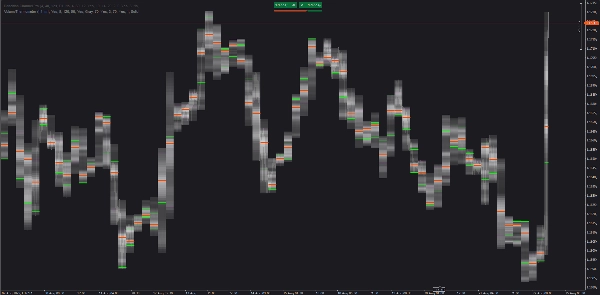
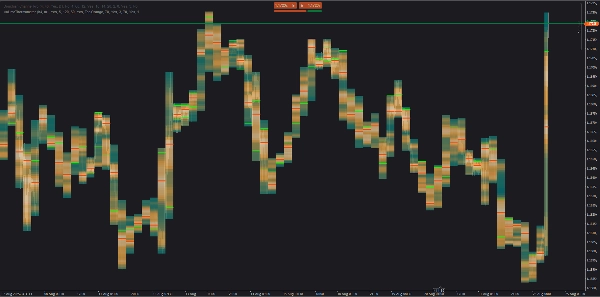
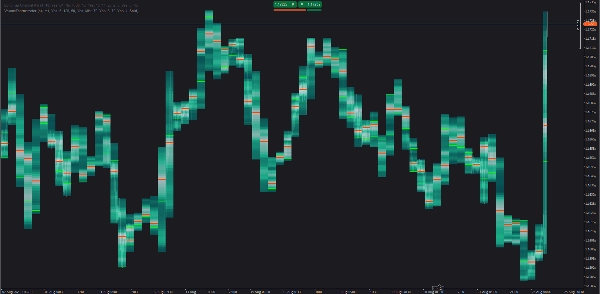
Une carte thermique cTrader qui montre comment le volume est réparti à l'intérieur de chaque bougie HTF. Elle utilise des barres LTF (par exemple, M1) pour construire des bacs de volume verticaux, puis trace POC et Value Area (VA) lignes. La bougie HTF actuelle (inachevée) est peinte en temps réel.
Comment ça fonctionne
- Agrège le volume de tick des barres LTF.
- Divise chaque bougie HTF en
Bacstranches de prix et attribue le volume par chevauchement de prix. - Colore les bacs selon le volume relatif ; trace POC, lignes VA optionnelles, et peut les étendre vers la droite.
- Charge automatiquement l'historique plus ancien pour la plage visible uniquement (petits lots).
Utilisez-le
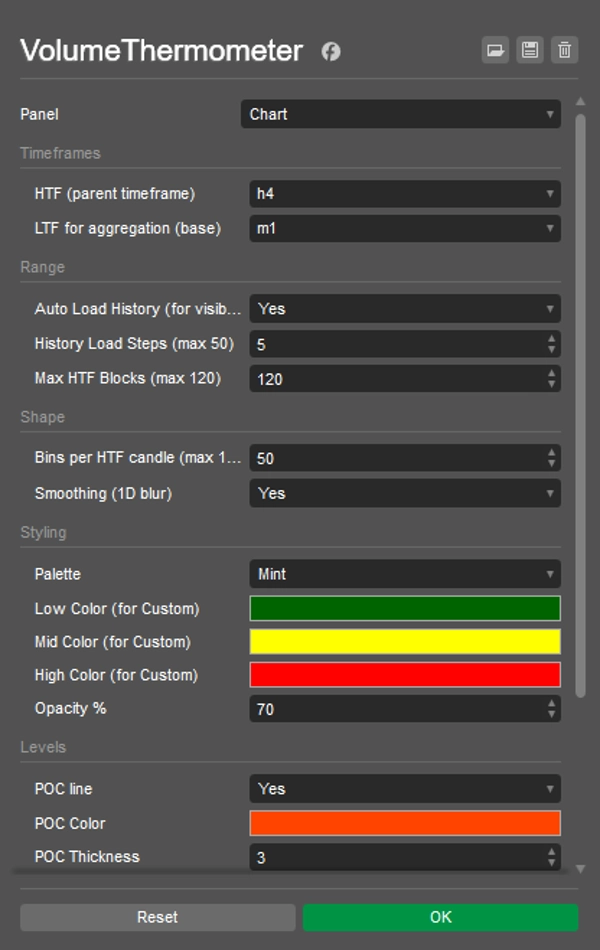
- Choisissez HTF (par exemple, H4) et LTF (par exemple, M1).
- Activez Chargement automatique de l'historique ; faites défiler/zoomez sur la plage souhaitée.
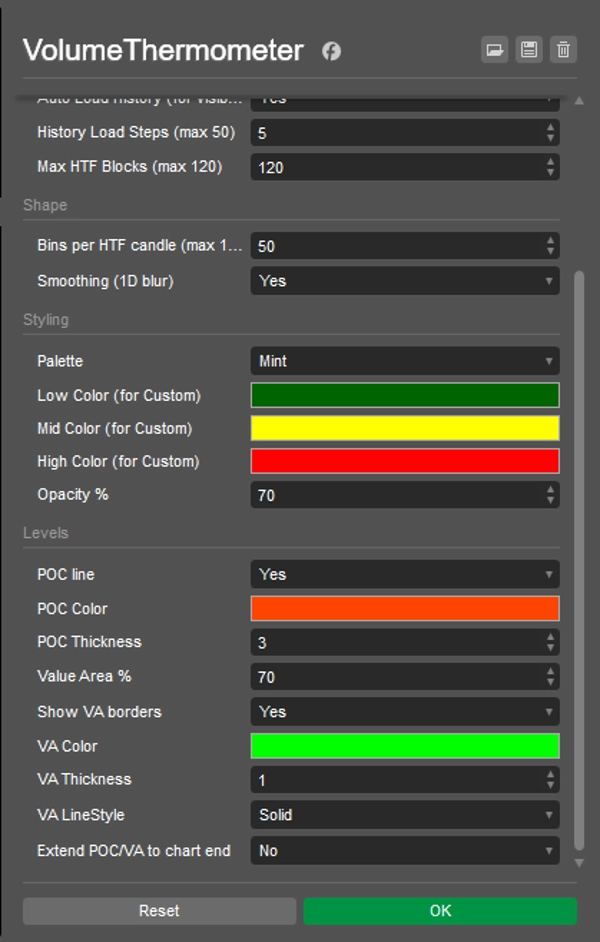
- Réglez Bacs (détail), Max HTF Blocks (combien de bougies afficher), Lissage, Opacité, et les couleurs.
- Observez les réactions POC/VA et comment le POC migre bougie par bougie.
Idées rapides
- Retest POC : premier contact avec le POC précédent avec confirmation LTF.
- Rotation VA : la réentrée dans la VA cible souvent le POC/autre bord de la VA.
- Passage LVN : les zones fines (froides) ont tendance à se déplacer rapidement vers le nœud suivant.
Notes
- Utilise le volume de tick (bon proxy sur FX/CFD, pas le volume d'échange).
- Pour la performance, réduisez Bacs ou Max HTF Blocks si nécessaire.
Résumé
Résumé IA
VolumeThermometer is a cTrader indicator that visualizes intra-higher timeframe (HTF) volume distribution using a heatmap. It aggregates tick volume data from lower timeframe (LTF) bars (e.g., M1) to construct vertical volume bins within each HTF candle (e.g., H4). The indicator highlights the Point of Control (POC) and Value Area (VA) lines, showing where the most volume is concentrated by price level. The current HTF candle is updated in real time, and the indicator automatically loads historical data for the visible chart range in small batches to optimize performance.
Key features include:
- Aggregation of tick volume from LTF bars.
- Division of HTF candles into price bins with volume assigned by price overlap.
- Color-coded volume bins indicating relative volume intensity.
- Display of POC and optional VA lines, with the ability to extend these lines forward.
- Customizable settings for bin detail, maximum HTF candles displayed, smoothing, opacity, and colors.
- Supports multiple markets including Forex, indices, commodities, stocks, and cryptocurrencies such as BTCUSD and EURUSD.
Users can monitor POC retests, VA rotations, and low volume node pass-throughs to analyze volume behavior within HTF candles. The indicator uses tick volume as a proxy, suitable for FX and CFD markets.
Profil de l'indicateur
Avis clients
0.0
Avis : 0
Avis clients
Il n'y a pas encore d'avis sur ce produit. Vous l'avez déjà essayé ? Soyez le premier à en parler aux autres !
Discussion
Questions fréquentes
BTCUSD
Prop
Forex
Indices
EURUSD
Commodities
Crypto
Stocks
NAS100
Les produits disponibles sur cTrader Store, notamment les bots de trading, les indicateurs et les plug-ins, sont fournis par des développeurs tiers et mis à disposition à titre informatif et à des fins d'accès technique uniquement. cTrader Store n'est pas un courtier et ne fournit aucun conseil en investissement, aucune recommandation personnelle ni aucune garantie quant aux performances futures.


Prix
Depuis le 26/05/2025
451.48M
Volume tradé
61.16K
Pips gagnés
15
Ventes
1.43K
Installations gratuites