
Moving Average Plus
Indicateur
144 téléchargements
Version 1.0, Aug 2025
Windows, Mac
Depuis le 26/05/2025
451.48M
Volume tradé
61.16K
Pips gagnés
15
Ventes
1.43K
Installations gratuites
Description
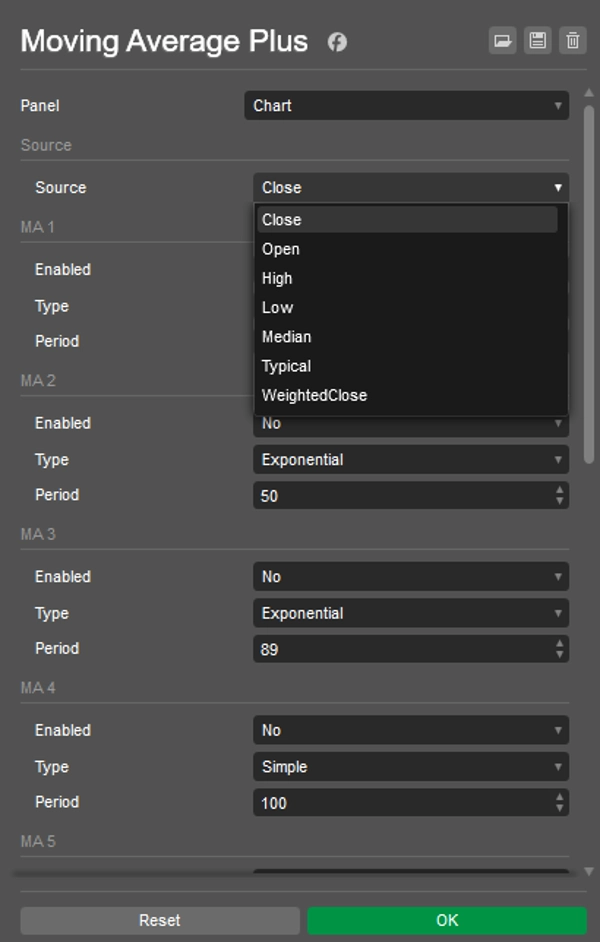
Global
- Source – prix utilisé par toutes les lignes : Close, Open, High, Low, Median, Typical, ou Weighted Close.
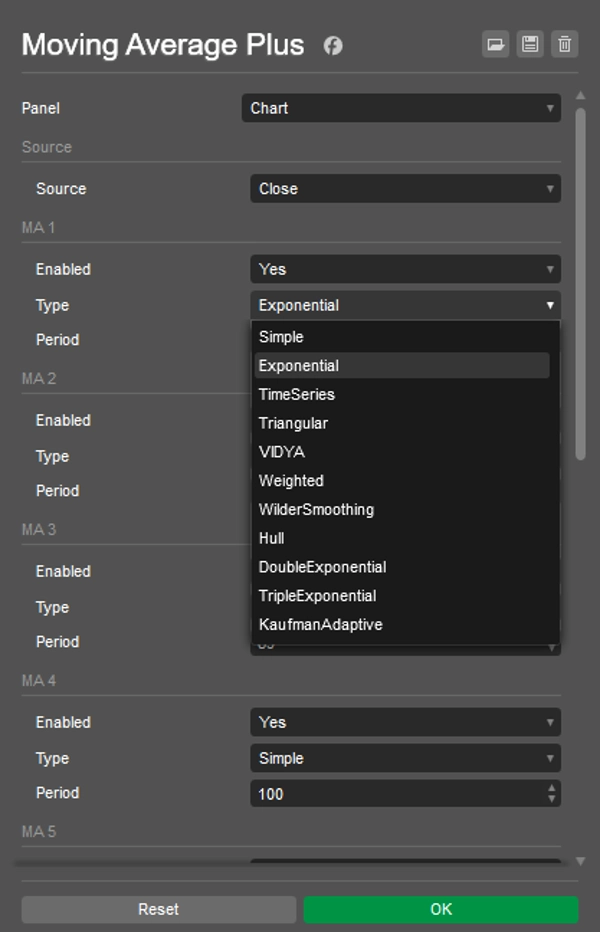
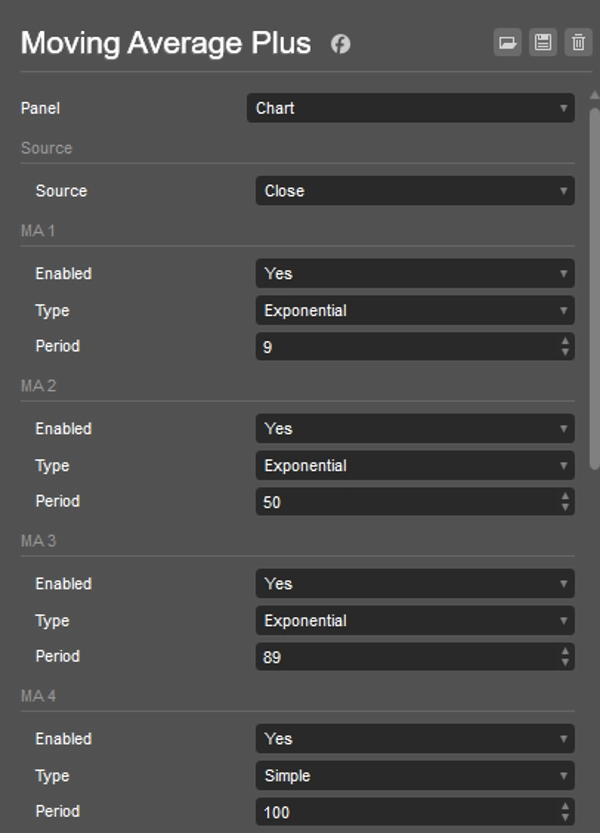
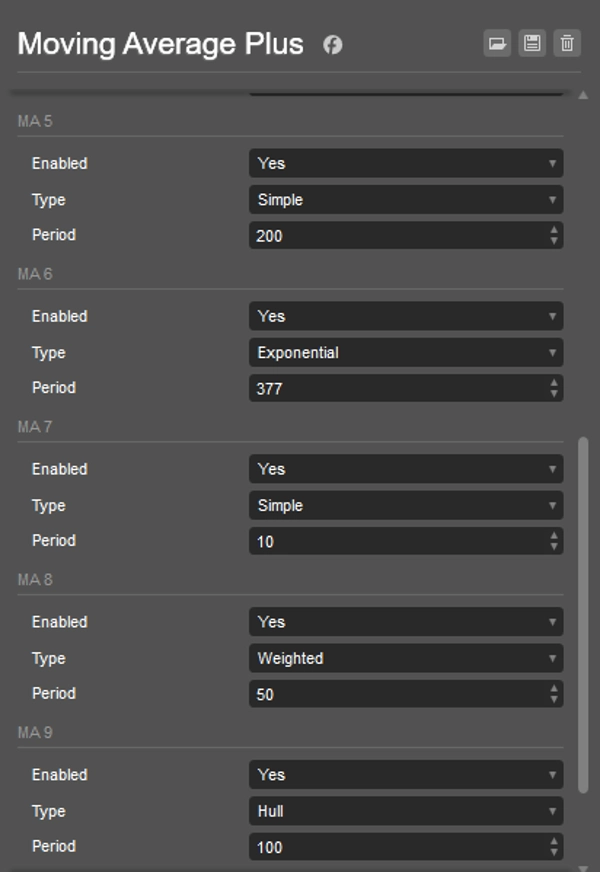
Par ligne (MA 1 … MA 10)
- Activé – activer/désactiver la ligne (les lignes désactivées ne sont pas calculées).
- Type – choisissez parmi les
MovingAverageTypede cTrader (par exemple, Simple, Exponentielle, Pondérée, Wilder Smoothing, Hull, Triangulaire, Séries Temporelles, etc.).
Remarque : certains types dépendent de votre version de cTrader ; si un type n’est pas disponible (par exemple, Hull), choisissez-en un autre. - Période – longueur de la MA (≥1).
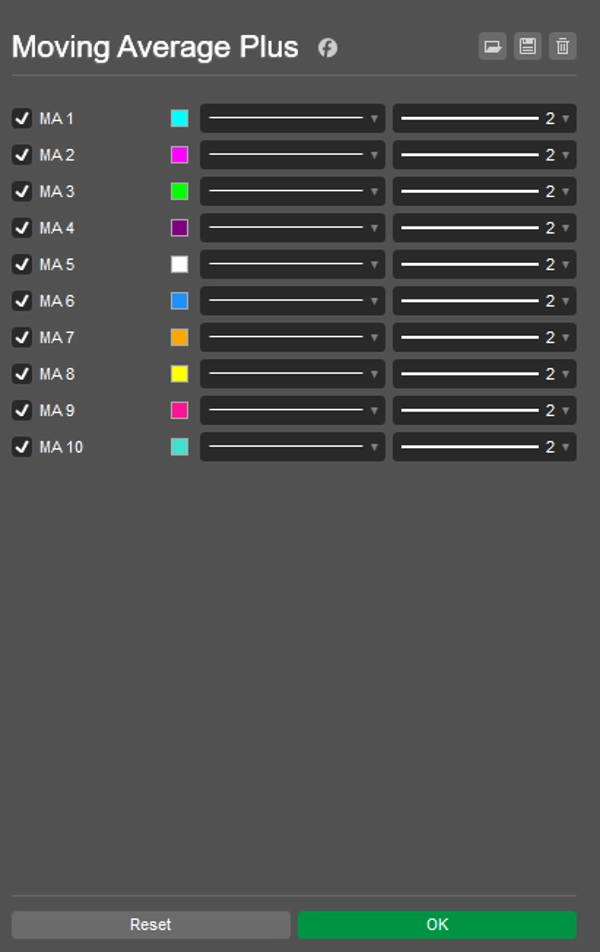
Couleurs & épaisseur
- Définies dans l’onglet Couleurs des paramètres de l’indicateur pour chaque sortie (“MA 1” … “MA 10”).
Conseils
- Pour les performances, désactivez les lignes inutilisées.
- Si vous modifiez Source ou Type/Période, l’indicateur se recalcule automatiquement.
- Wilder dans cTrader s’appelle Wilder Smoothing (
MovingAverageType.WilderSmoothing).
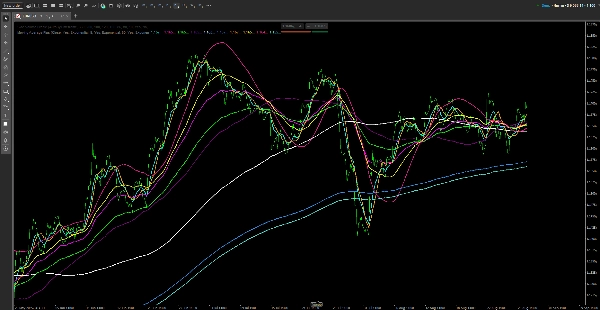
Résumé
Résumé IA
Moving Average Plus is a technical indicator for trading platforms that provides up to 10 configurable moving average lines. Each line can be individually enabled or disabled to optimize performance. Users select a single price source—such as Close, Open, High, Low, Median, Typical, or Weighted Close—that applies to all moving averages. For each line, the type of moving average can be chosen from various options including Simple, Exponential, Weighted, Wilder Smoothing, Hull, Triangular, and Time Series, depending on platform support. The period (length) of each moving average is adjustable with a minimum of 1. Colors and line thickness for each moving average are customizable through the indicator’s color settings. The indicator automatically recalculates when changes are made to the price source, type, or period. This tool is designed to assist traders in analyzing price trends by overlaying multiple moving averages with flexible configurations on their charts.
Profil de l'indicateur
Avis clients
0.0
Avis : 0
Avis clients
Il n'y a pas encore d'avis sur ce produit. Vous l'avez déjà essayé ? Soyez le premier à en parler aux autres !
Discussion
Questions fréquentes
Les produits disponibles sur cTrader Store, notamment les bots de trading, les indicateurs et les plug-ins, sont fournis par des développeurs tiers et mis à disposition à titre informatif et à des fins d'accès technique uniquement. cTrader Store n'est pas un courtier et ne fournit aucun conseil en investissement, aucune recommandation personnelle ni aucune garantie quant aux performances futures.


Prix
Depuis le 26/05/2025
451.48M
Volume tradé
61.16K
Pips gagnés
15
Ventes
1.43K
Installations gratuites