
TrendStrengthSignals
Indicateur
Version 1.0, Aug 2025
Windows, Mac
5.0
Avis : 1
Depuis le 26/05/2025
385.09M
Volume tradé
60.66K
Pips gagnés
14
Ventes
1.4K
Installations gratuites
Description
Une boîte à outils visuelle pour le trading de tendance qui combine une enveloppe de volatilité avec un canal conscient du cycle pour montrer le régime, le timing et le risque en un coup d'œil. Elle est conçue pour être lisible sur n'importe quel fond (clair/sombre) et pour garder l'écran propre tout en vous donnant des indices sur « ce qu'il faut faire ensuite ».
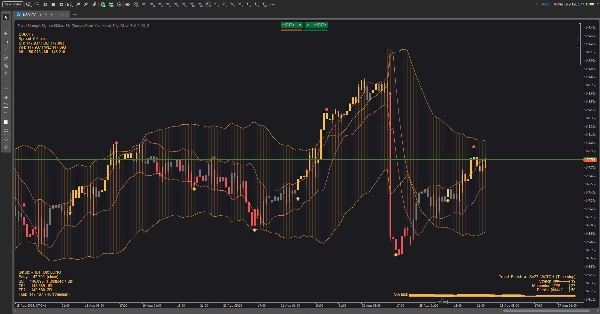
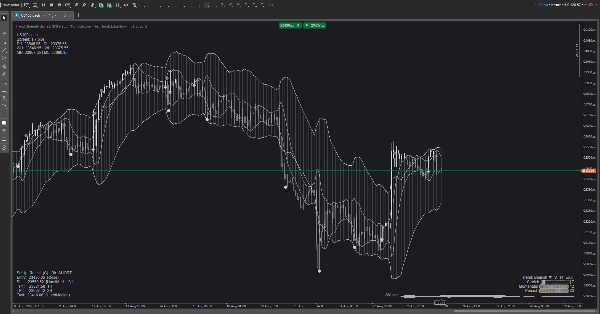
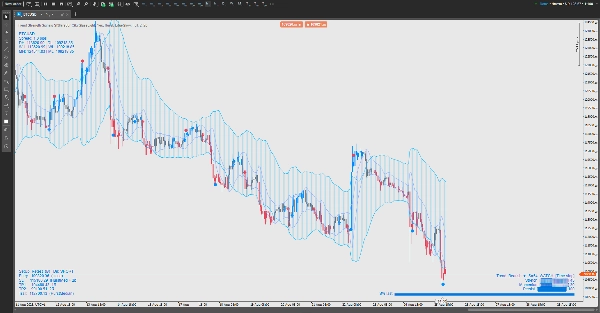
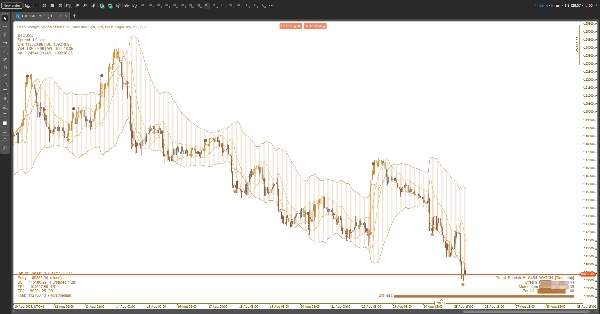
Ce que vous voyez sur le graphique
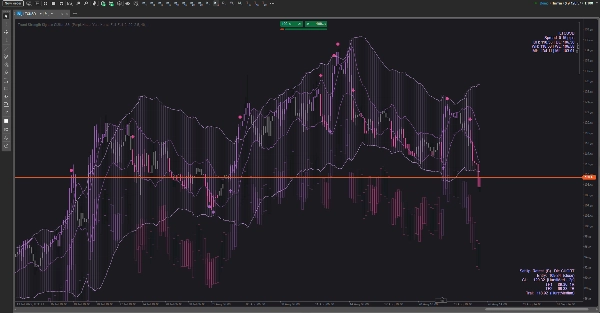
- Nuages (activables) :
-
- Un nuage de volatilité qui s'étend/se contracte avec l'activité du marché.
- Un nuage de cycle qui suit le rythme roulant du prix.
- Vous pouvez afficher l'un, les deux ou aucun.
- Signaux : flèches discrètes haut/bas pour les changements de tendance potentiels ; petits points pour les incitations à prendre des bénéfices.
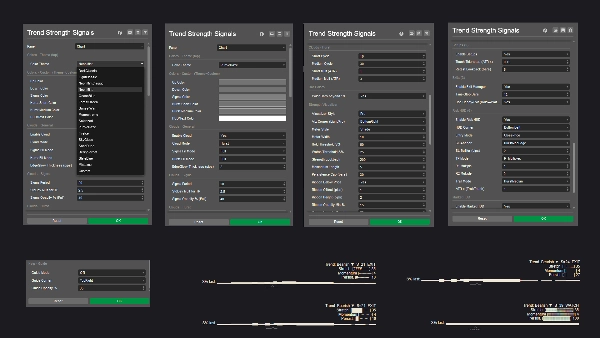
- HUD de force de tendance (trois styles) :
-
- Léger — une étiquette de statut compacte.
- Pro — un petit tableau de bord avec trois jauges (étirement, momentum, persistance) plus un mini graphique historique.
- Ruban — une barre douce près du prix dont l'intensité suit la force de la tendance.
- HUD de risque : propose une direction, une zone de stop protectrice, deux objectifs de profit en couches, et une idée de suivi optionnelle. Il se place dans n'importe quel coin que vous choisissez et se met à jour au fur et à mesure de l'évolution de la barre.
- HUD de marché : symbole & spread, plus les références haut-bas jour/semaine/mois, pour que vous sachiez toujours où vous vous situez dans la carte plus large.
- Thèmes : ensembles de couleurs sélectionnés pour les graphiques clairs et sombres (et un mode personnalisé). Tous les éléments graphiques — y compris les HUD et les signaux — suivent le thème actif.
Comment l'utiliser (pratique, pas technique)
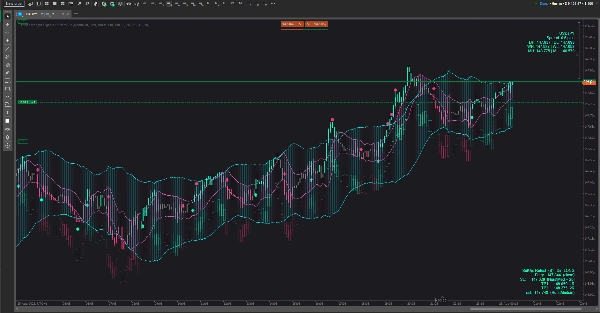
- Choisissez votre vue de nuage :
-
- Utilisez le nuage de volatilité pour voir les compressions et expansions.
- Utilisez le nuage de cycle pour juger des rotations « bord » vs « milieu ».
- Utilisez les deux si vous voulez contexte + timing.
- Lisez la force de la tendance :
-
- Lorsque le statut monte à HOLD, orientez les trades dans la direction actuelle ; lorsqu'il descend à WATCH, réduisez l'agressivité ; s'il affiche EXIT, évitez les nouveaux trades ou resserrez le risque.
- En mode Pro, jauges en hausse + mini graphique en hausse = qualité en amélioration ; jauges en baisse = gérez le risque à la baisse.
- Synchronisez les entrées avec le prix vs le nuage :
-
- Les cassures après compression, les ré-entrées après un repli poli vers le nuage, ou les rebonds sur un bord extérieur sont les modèles de base.
- Si une flèche précoce apparaît au milieu de la barre puis disparaît, attendez la confirmation à la clôture de la barre si vous préférez moins de faux signaux.
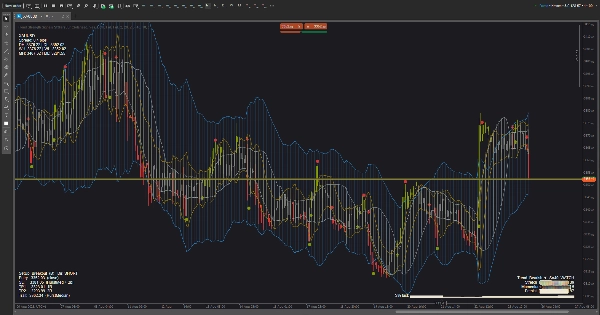
- Gérez le trade avec le HUD de risque :
-
- Placez le stop protecteur approximativement au-delà de la limite structurelle la plus proche que le HUD met en évidence.
- Sortie partielle à TP1, laissez le reste viser TP2 ou suivez la ligne de suivi suggérée.
- Si la force de la tendance décroit de forte à faible, envisagez de sortir plus tôt.
- Filtres situationnels :
-
- Évitez les entrées lorsque les nuages sont fins et hachés, ou lorsque le statut de force est en EXIT.
- Favorisez les trades lorsque la force se construit, que le nuage est incliné, et que le prix interagit proprement avec les bords.
Personnalisation
- Changez les coins du HUD, le style de visualisation et le thème de couleur pour correspondre à votre espace de travail.
- Les thèmes adaptés à la lumière gardent le texte visible sur des fonds blancs ; les palettes océan/forêt/coucher de soleil ajoutent un contraste subtil sans éblouissement.
Ce que ce n’est pas
Ce n'est pas un autotrader boîte noire. C'est une aide à la décision : il cadre la qualité de la tendance, propose des emplacements de risque sensés, et met en évidence des moments à haute probabilité — mais vous restez aux commandes.
Résumé
Profil de l'indicateur
Avis clients
5.0
Avis : 1
5 | 100 % | |
4 | 0 % | |
3 | 0 % | |
2 | 0 % | |
1 | 0 % |
Avis clients
September 2, 2025
The reason it feels usable is direction is easier to respect, and a 1R exit plan makes review easier.
Discussion
Questions fréquentes
Les produits disponibles sur cTrader Store, notamment les bots de trading, les indicateurs et les plug-ins, sont fournis par des développeurs tiers et mis à disposition à titre informatif et à des fins d'accès technique uniquement. cTrader Store n'est pas un courtier et ne fournit aucun conseil en investissement, aucune recommandation personnelle ni aucune garantie quant aux performances futures.


![Logo de "[Hamster-Coder] Pivot Points MTF"](https://cdn.ctrader.com/image/webp/4c143e5a-309c-40e3-a578-f04d1e133ffa_31159)


Prix
Depuis le 26/05/2025
385.09M
Volume tradé
60.66K
Pips gagnés
14
Ventes
1.4K
Installations gratuites