
Institutional Flow Radar
Indicateur
3 achats
Version 1.0, Nov 2025
Windows, Mac
4.3
Avis : 3
Description
Radar des flux institutionnels – Description
Concept :
Le Radar des flux institutionnels analyse le graphique à la recherche d’événements de volume anormaux et les classe en deux groupes :
- Capital → activité attribuée à des participants plus forts / mieux informés
- Public → activité attribuée à la foule plus large
Il fait ensuite :
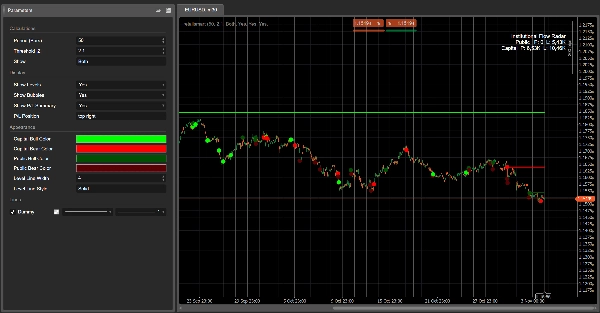
- trace des niveaux horizontaux à ces événements,
- marque les événements les plus pertinents avec des bulles colorées,
- et affiche un résumé P/L comparant combien de volume de Capital vs Public est actuellement en profit ou en perte.
En un coup d’œil, vous voyez où un gros volume a frappé la bande, qui gagne, et quels prix tiennent encore.
Comment ça fonctionne (version courte)
- Pour chaque barre, l’algorithme calcule un score Z du volume sur les N dernières barres (Période).
- Si la valeur absolue du score Z est supérieure à votre seuil |Z|, cette barre est marquée comme un événement de volume.
- La structure de la bougie (corps vs plage totale) est utilisée pour classer l’événement :
-
- corps plus petit, longues mèches → Capital (absorption / comportement plus complexe)
- corps plus grand, mouvement directionnel → Public (rupture / poursuite de style foule)
- Un niveau horizontal est tracé au prix de l’événement et conservé jusqu’à ce que le prix franchisse clairement ce niveau (atténuation).
- Pour chaque niveau actif, le Radar vérifie si le prix actuel est :
-
- en profit pour ce côté (le prix a évolué dans la direction de l’événement), ou
- en perte (le prix a évolué contre lui).
- La boîte de résumé P/L agrège les volumes de tous les niveaux actifs :
-
- Profit Capital vs Perte Capital
- Profit Public vs Perte Public
Éléments visuels
- Niveaux Capital :
-
- Événements haussiers → niveau Capital haussier (ex. vert vif / aqua)
- Événements baissiers → niveau Capital baissier (ex. rouge vif)
- Niveaux Public :
-
- Événements haussiers → niveau Public haussier (ton grisâtre)
- Événements baissiers → niveau Public baissier (gris plus foncé / charbon)
- Bulles :
-
- Cercles sur les événements les plus significatifs, colorés selon :
-
- la direction (haussier/baissier)
- la classe (Capital / Public)
- Boîte de résumé P/L :
-
- Lignes : Public, Capital
- Colonnes : Profit, Perte
- L’intensité de l’arrière-plan des cellules augmente avec le volume correspondant.
Étiquettes de paramètres suggérées (anglais)
- Période (Barres) : nombre de barres utilisées pour calculer le score Z du volume.
- Seuil |Z| : score Z absolu minimum pour marquer un événement.
- Afficher :
Capital,Public, ouLes deux– quelle classe afficher. - Afficher les niveaux / Afficher les bulles / Afficher le résumé P/L
- Couleur haussière Capital / Couleur baissière Capital
- Couleur haussière Public / Couleur baissière Public
- Largeur moyenne de ligne / Style moyen de ligne
Résumé
Résumé IA
Institutional Flow Radar is a trading indicator that identifies and classifies abnormal volume events on price charts into two categories: Capital (activity from stronger or more informed participants) and Public (activity from the broader crowd). It calculates a volume Z-score for each bar over a specified period and flags bars exceeding a set threshold as volume events. These events are further classified based on candle structure—smaller bodies with long wicks indicate Capital activity, while larger bodies with directional moves indicate Public activity.
The indicator visually marks these events by drawing horizontal levels at event prices, which remain until price moves decisively through them. Significant events are highlighted with colored bubbles indicating direction (bullish or bearish) and classification (Capital or Public). A P/L summary box aggregates volume at active levels, showing Capital and Public volumes currently in profit or loss.
Users can customize parameters such as the period for Z-score calculation, threshold for event detection, and visual settings including colors for bullish and bearish levels for both Capital and Public groups. This tool provides a consolidated view of where large volume occurred, which participant group is prevailing, and which price levels are holding, aiding in volume-based breakout analysis.
Profil de l'indicateur
Avis clients
4.3
Avis : 3
5 | 33 % | |
4 | 67 % | |
3 | 0 % | |
2 | 0 % | |
1 | 0 % |
Avis clients
November 18, 2025
The only reason it stays interesting is the trading notes stop feeling so random, and two sessions say more than one clean chart.
November 9, 2025
Discussion
Questions fréquentes
Breakout
Les produits disponibles sur cTrader Store, notamment les bots de trading, les indicateurs et les plug-ins, sont fournis par des développeurs tiers et mis à disposition à titre informatif et à des fins d'accès technique uniquement. cTrader Store n'est pas un courtier et ne fournit aucun conseil en investissement, aucune recommandation personnelle ni aucune garantie quant aux performances futures.


![Logo de "[Stellar Strategies] MARSI Signal Plotter"](https://cdn.ctrader.com/image/webp/7b2b8da6-8f8e-4646-8d4a-4710c516c01e_25567)


Prix
42.11M
Volume tradé
6.13M
Pips gagnés
221
Ventes
8.34K
Installations gratuites