
Description
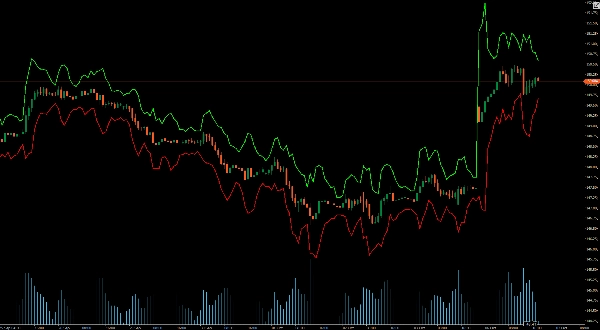
Bandes ATR affichent dynamiquement des bandes supérieures et inférieures sur vos graphiques de prix.
Ces bandes offrent des informations en temps réel sur la volatilité du marché, vous aidant à identifier avec précision les points potentiels de rupture et de retournement. Parfaites pour les traders de tous niveaux, les Bandes ATR améliorent votre processus de prise de décision en fournissant des indices visuels clairs pour définir les stop-loss, take-profits et optimiser les points d'entrée.
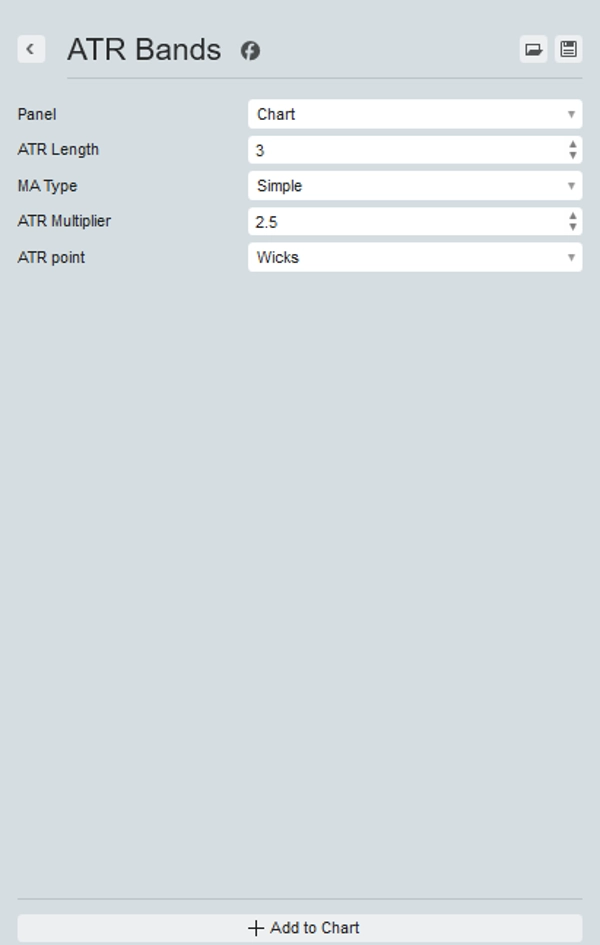
Les paramètres permettent de choisir votre période et multiplicateur préférés, de changer la moyenne mobile utilisée pour calculer l'ATR et d'utiliser les mèches des chandeliers ou la clôture des chandeliers.
Améliorez votre boîte à outils de trading dès aujourd'hui et faites l'expérience de la différence avec les Bandes ATR – votre avantage sur le marché.
Résumé
Avis clients
5 | 67 % | |
4 | 33 % | |
3 | 0 % | |
2 | 0 % | |
1 | 0 % |


