
Description
Présentation de l'indicateur TradingView ATR pour cTrader, conçu pour correspondre à la précision du calcul de la plage vraie moyenne de TradingView.
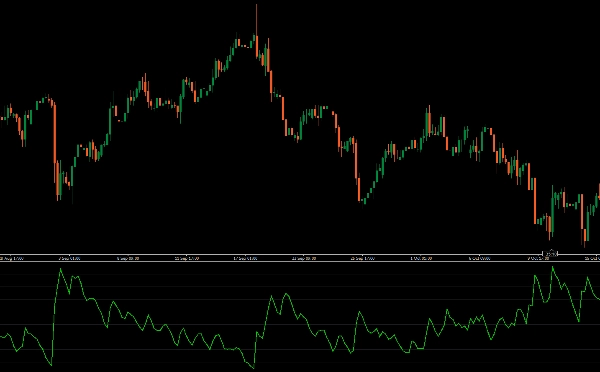
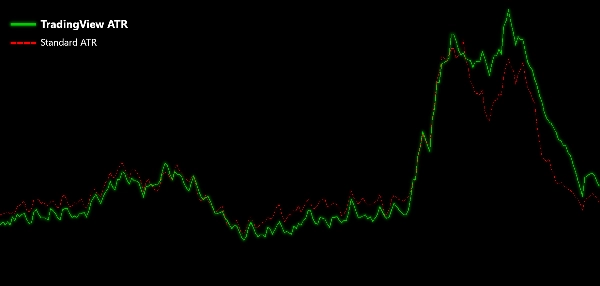
Cet ATR amélioré utilise une moyenne mobile relative (RMA) pour ses calculs, offrant une réflexion plus précise de la volatilité du marché par rapport à l'ATR par défaut dans cTrader. En incorporant la RMA, cet indicateur propose des lectures de volatilité plus lisses et plus réactives, vous aidant à prendre des décisions de trading mieux informées.
Parfait pour les traders recherchant une meilleure précision dans leur analyse technique, cet indicateur ATR est un outil puissant pour améliorer votre stratégie de trading.
Améliorez votre boîte à outils cTrader avec cet indicateur ATR pour des informations précises et fiables sur la volatilité.
Résumé
Avis clients
5 | 100 % | |
4 | 0 % | |
3 | 0 % | |
2 | 0 % | |
1 | 0 % |


